Due to Popular Demand Fiat Economics is Expanding and has moved to its own Domain:

Sunday, July 27, 2008

A Look at Chinese and Hong Kong ADR’s

In this piece I highlight 66 Chinese and Hong Kong ADRs by sector, broken out by market cap, average 30 day volume, and a series of performance metrics. This piece will eventually be followed-up with specific analysis on Chinese sectors and companies. Before getting to the nitty gritty lets formulate a quick outlook on the global and Chinese economies.

As everyone by now has realized decoupling of the financial markets holds less credibility than the Loch Ness monster. This notwithstanding, I anticipate growth in developing emerging market economies, especially China, will continue to outpace their industrialized counter parts in the years to come, albeit it not at the pace we have grown accustomed to seeing. It is also very likely we will see domestic demand take over as the new engines of growth in these economies. The cause is simple, industrial nations, particularly the US, will experience slowdowns in consumption, hence overall growth over the next several years as wealth continues to deteriorate. The effect, less demand for foreign goods will likely cause trade balances to become a drag on growth for many EM export oriented economies On the other hand, this should be at least partially off-set by what I expect to be continued strong growth in the domestic sector. Domestic Consumption and investment should remain robust for many EM countries after experiencing high growth and a developing domestic economies.

With that said lets look at China, where the global slow-down coupled with an appreciating currency is a double whammy for exports. But how has the Chinese domestic market performing? In a nutshell the answer is good. According to China’s 2Q08 GDP figures domestic investment and consumption continue to experience significant growth. In fact, the June retail sales figure demonstrated 23%yoy growth. So why have Chinese equities faced such a bad year? Well I don’t believe there is any one specific reason for this, but a combination of factors including fears of monetary tightening, investors’ flight to quality, and liquidity issues in the global financial sector stemming from the housing crisis. I anticipate that as fears ease and liquidity returns to the market we could see a significant buy-back of Chinese equities. Additionally, as the Chinese export sector continues to deteriorate there is a growing possibility we could see a pull-back of domestic macro-policies aimed at preventing the over-heating of the domestic economy. This could include anything from increasing loans quotas to reducing reserve requirements. With this said, in the long-run I am bullish on the Chinese domestic sector, while slightly bearish on export oriented industries. There are of course risks, and I advise you to read some of my previous posts and other research. I will go into further detail on sectors and companies in future posts. Now let’s look at the ADRs:

Year to date the 66 Chinese and Hong Kong ADRs I tracked lost 24.0% of their value in market weighted terms, significantly outperforming the domestic Shanghai SE Composite Index which returned -45.6% during the same period, but underperforming Hong Kong’s Hang Seng Index which returned -18.4%. The best performing company was China’s VisionChina Media (VISN) which returned 167.1%ytd, while the worst performer was Hong Kong’s Corgi International (CRGI) which lost 73.0% during the same time period. Interesting to note is that in 2007 nearly 70% of Corgi’s revenues were derived from the US. The best performing GICS sectors for the ADRs were consumer discretionary, health care and IT which all lost 15%ytd in market weighted terms. The worst performing sector has been industrials, which lost 54%ytd. Please look at tables below for further details:


ADR’s sorted by Sector & Market Cap*
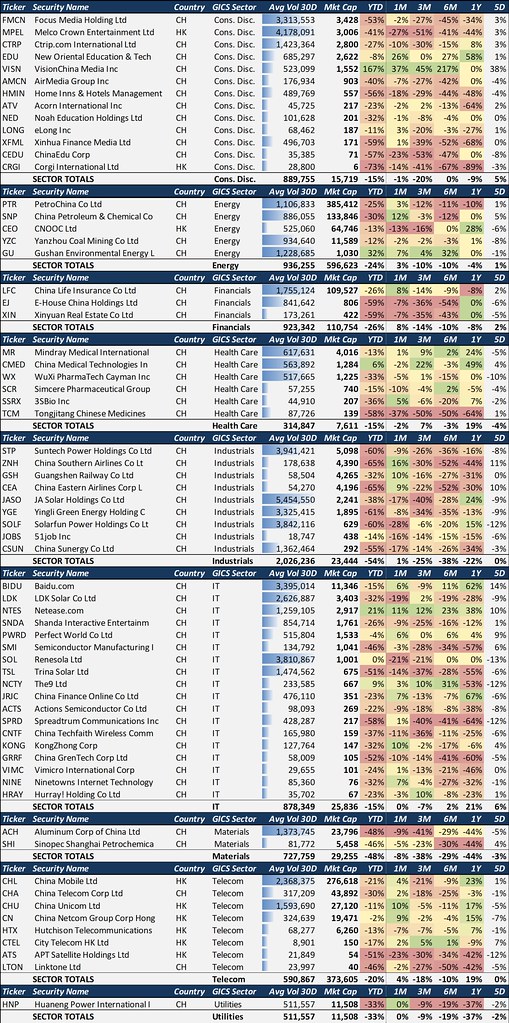
*Sector Performance is Market Cap Weighted

Source: Bloomberg

To be continued...


Quick Description from Bloomberg of top 10 ADRs by Market Cap

  1. PetroChina (PTR): PetroChina Company Limited explores, develops, and produces crude oil and natural gas. The Company also refines, transports, and distributes crude oil and petroleum products, produces and sells chemicals, and transmits markets and sells natural gas.
  2. China Mobile (CHL): China Mobile Limited, through its subsidiaries, provides cellular telecommunications and related services in the People's Republic of China and Hong Kong SAR.
  3. China Petroleum & Chemical (SNP): China Petroleum and Chemical Corporation (Sinopec) explores for and produces crude oil and natural gas in China. The Company also owns refineries that make petroleum and petrochemical products such as gasoline, diesel, jet fuel, kerosene, ethylene, synthetic fibers, synthetic rubber, synthetic resins, and chemical fertilizers. In addition, Sinopec trades petrochemical products.
  4. China Life Insurance Company (LFC): China Life Insurance Co., Limited offers a wide range of life, accident, and health insurance products and services.
  5. CNOONC (CEO): CNOOC Limited, through its subsidiaries, explores, develops, produces, and sells crude oil and natural gas.
  6. China Telecom (CHA): China Telecom Corporation Limited, through its subsidiaries, provides wire line telephone, data, and Internet, as well as leased line services in China.
  7. China Unicom (CHU): China Unicom Limited, through its subsidiaries, provides telecommunications services in the People's Republic of China. The Company's services include cellular, paging, long distance, data, and Internet services.
  8. Aluminum Corporation of China (ACH): Aluminum Corporation of China Limited is a producer of alumina and primary aluminum in China. The Company refines bauxite into alumina and smelts alumina to produce primary aluminum.
  9. China Netcom (CN): China Netcom Group Corporation (Hong Kong) Limited is a fixed-line telecommunications operator in China and an international data communications operator in the Asia-Pacific region. The Company provides broadband and other Internet-related services, including DSL and LAN services, business and data communications.
  10. Yanzhou Coal Mining (YZC): Yanzhou Coal Mining Company Limited operates underground mining and coal preparation and operation businesses. Its products are sold in domestic and international markets. The Company also provides railway transportation services.

**Disclaimer: Author holds long positions in China Mobile(CHL) & EHouse (EJ)

Sunday, July 13, 2008

Impending Chinese Financial Crisis…

Sitting here in Hong Kong, I know few people who aren’t transferring money into China to take advantage of the appreciating RMB and attractive domestic rates. In fact a study conducted by the Chinese Academy of Social Sciences estimates there could be over USD1.0trn of such money within China, with USD150bn coming during the first five months of 2008. The good news for these investors is that the RMB is still expected to appreciate over the next 1 to 2 years as the Chinese government continues to correct economic imbalances. However, there is bad news. Eventually, the RMB appreciation will peak, and those investors’ solely within the country to take advantage of the appreciating currency will begin to pull-back. This will likely cause liquidity problems within the Chinese economy, and will lead to further depreciation as more investors attempt to withdraw their funds. This potential crisis has not gone unnoticed. *The branch head of the Jiangsu province China Banking Regulatory Commission released in a paper this week the following comments;

“The initial judgment is that China's financial crisis will kick off between 2009 and 2010, though it may be a year or two later, and will be triggered by a turning point in yuan appreciation…”

“By that time, international capital will flow out instead of coming in and the yuan will face depreciation instead of appreciation pressure. China will face a liquidity shortage and financial crisis will therefore follow.”

In fact looking at the RMB NDF rates, we can see that the market is currently pricing in a slight RMB depreciation around the 3-year time horizon (chart below). In fact, back in May we even saw the 1-month contract briefly imply depreciation for the RMB, demonstrating the potential volatility of the market. This notwithstanding, we have begun to see the growth rate of Chinese exports slow, a trend we expect to continue. This coupled with an unwavering demand for imports, will place a stronger weight on the domestic sector to support China’s growth. To make matters worse for the export sector the Chinese government has initiated new capital controls to reduce the amount of 'hot money' that may be hidden within the sector (i.e. through over-invoicing). Some estimates have placed the amount of hot money hidden within the sector at around 2% of exports. The good news is that the increased importance of the domestic market within China could cause the government to reduce some restrictions on the sector, meant to reduce over-heating within the economy. Yet, a conundrum could arise if Chinese inflation rates once again begin to accelerate. However, at this point most analysts’ estimates are calling for inflation to slow.

The Current RMB NDF Implied Rates show the RMB Depreciating Slightly in 3-Years

Source: Bberg

The bottom line is that China is facing a potential financial crisis that could occur sometime over the next 2 to 4 years. I will continue to look at the RMB NDF market and changes to the government’s foreign exchange policy as potential forward looking indicators to this crisis. In the meantime, the slow-down in Chinese exports will likely have 2 short term effects, 1) a decelerated RMB appreciation, & 2) the potential for authorities to lift some regulations put in place to prevent the domestic economy from over-heating. This could have positive effects on the local equity markets, after facing significant losses from their previous highs. In fact, last week we already began to see the local equity markets respond favorably to the possibilities of less stringent economic policies.


*http://www.quamnet.com/newscontent.action?articleId=889534

Tuesday, July 8, 2008

A Quick Look at the Asian CDS Market

Recently, I have been attempting to locate data on the Asian credit default swap (CDS) market, specifically on sovereign protection; I couldn’t find much. In response I decided to put together this posting, which tracks performance and allows for some basic relative value and correlation analysis verse equity markets. All CDS prices quoted in this entry are 5yr protection on each governments’ international bonds.

A credit default swap is an agreement between two parties, in which one party pays a premium to the other party, who in return provides protection against the default of an underlying bond. A CDS can be written or bought by anyone, even if they do not own the underlying bond. Since the price of the CDS is the amount a buyer is willing to pay for protection against a potential default it goes without saying that the price is a good measurement of market implied risk. This also means there should be some correlation between sovereign ratings and the sovereign CDS prices.

To start, let’s take a look at the three major rating agencies rating systems. The chart below breaks out each of the major rating companies systems, with the green area representing investment grade ratings and the red area representing non-investment grade ratings. I have also included the credit ratings of the Asian countries for each of the 3 agencies (see below).

Moodys, S&P, & Fitch Credit Ratings

Asian Countries Credit Rating

Next, I created a composite rating system for the countries being analyzed. To do this I assigned number values to the above rating system with the highest rating for each agency equaling 1, and the lowest rating equaling 21. In the case an agency had a positive outlook for any given country I subtracted 0.5 from their score (i.e. a S&P rating of AA would equal 3, but an AA rating with a positive outlook would equal 2.5). I then averaged these results together for each country and created the consolidated rating (see chart below).

Composite Asian Credit Ratings

You can see from the chart above that for each country, except Vietnam, current CDS prices correspond well to each countries composite credit rating. The next step is to look at each countries CDS performance to determine shifts in implied market risk, especially given the current credit crisis and large equity sell-offs.

Historical 5yr CDS Japan, Hong Kong, & China

Hong Kong - China 5yr CDS Spread

Source: Bberg

Over the past couple of months CDS prices in Hong Kong and China have seen a significant rise, this corresponds to the recent equity sell-off in both countries. Japanese CDS prices also rose, but remained somewhat contained compared to Hong Kong and China. It is important to highlight that year to date the Nikkei 225 is down 14.86% verse 23.70% & 46.5% for the Hang Seng and Shanghai indices, respectively. Recently, we have witnessed significant volatility between the Hong Kong and Chinese 5yr CDS spread; nevertheless the spread has begun to revert back to its historical average of around 12bps.

Historical 5yr CDS Korea, Malaysia, & Thailand

Source: Bberg

Similar performance can be seen for 5yr CDS in the Korean, Malaysian, and Thai markets. Generally speaking we have seen the spreads between Thailand, Malaysia and Korea moving tighter during the recent volatility.

Historical 5yr CDS Philippines, Indonesia, & Vietnam

Source: Bberg

Finally, and possibly most interesting we have seen 5y CDS move significantly higher in Vietnam. This comes despite the fact that over the past several years the spread between 5yr Vietnamese CDS and that of Indonesia and the Philippines has remained relatively constant. I believe the reason for this is due to growing concern over Vietnam’s economy and a growing conflict between the government plan to maintain economic growth and the central bank’s goal of controlling growing pricing pressures.

Finally, the following charts show each countries’ CDS movements verse the main domestic equity Index; CDS could be used as a hedge against regional equities. CDS prices tend to have a negative correlation with a country’s underlying equity index. This notwithstanding, hedging an individual equity via sovereign CDS will likely not hedge against intra-day or company specific price movements but will hedge against fundamental economic changes within the country. It is important to keep in mind that companies with traded debt may have its on CDS. However, at this point within Asia this market does not yet seem to be very robust.

Charts:

Source: Bberg


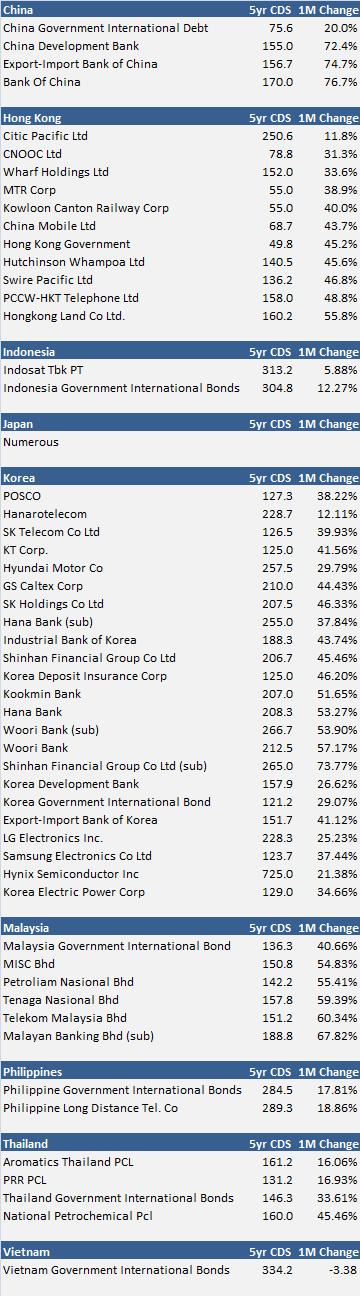
List of CDS traded in Asia

Source: Bberg (pricing from 7/7/08)

Friday, July 4, 2008

S&P500 Short Interest Ratio

Back in March I published some data on the NYSE top 100 short interest ratio (SIR), and a lot of people seemed to enjoy it. I am now following that up with June SIR data for all the S&P500 companies. I broke out the data alphabetically, descending SIR, and by the monthly change of the short interest ratio. Please follow the links below for the tables.

Sorted By:
Company Name
SIR Largest to Smallest
SIR Change (6/30/08-6/15/08)

*Source:Bberg

How might this be helpful? Well besides giving investors an idea of market sentiment on specific securities or sectors; it also creates the opportunity for a potential short squeeze. A short squeeze is when investors cover their short positions in order to stop losses by purchasing the equities on the open market, in theory bringing up the securities price. So, the higher the SIR the higher the potential magnitude of a short squeeze. The Short interest ratio is the amount of days it would take to cover the equities total short interest given its average daily trading volume.

Wednesday, July 2, 2008

Global Battery Index

As oil prices continue soaring and consumers’ preference shifts to smaller and more fuel efficient vehicles, we are likely to see a proliferation of hybrid technology. Looking at the most recent car sales data in the US, Honda and Hyundai out-sold both GM and Ford mostly due to their wide selection of smaller more fuel efficient vehicles. So what does this have to do with batteries? I believe quite a lot... It would appear the next natural progression in the auto industry will be the development and sale of plug-in hybrids (PHEV). Thus far, production of PHEVs has been extremely limited, mostly due to battery related issues. However, given the current record oil prices and recent advancements in battery technology it is likely this market will show significant growth over the next several years.

Currently, both GM and Toyota are hoping to release PHEVs by 2010. While Ford’s current plan is to release PHEVs sometime between 2012 and 2020. However, Ford’s senior energy storage manager was recently quoted saying, ``If there's going to be a true plug-in hybrid market, we're going to be there. It's just that that's a huge commitment to actually go to production.'' Which indicates to me that for the time being Ford will be sitting on the side-line. Coincidentally, Ford’s June sales decreased by 28%, mostly due to their lack of fuel-efficient cars and trucks relative to some of their peers.

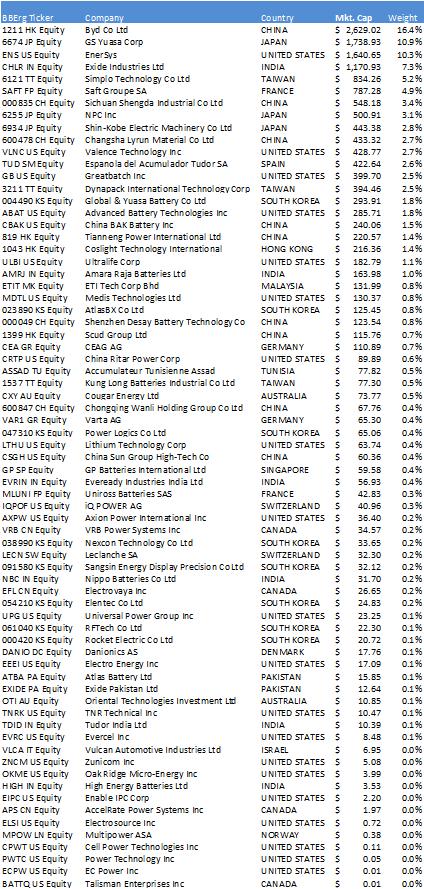
The proliferation of hybrids & PHEVs would place large demands on the battery industry, which could provide investors with good investment opportunities within the sector. However, I personally know very little about the players in the global battery industry, so I decided to give myself a quick primer. According to Bberg’s industry classification system, globally the batteries & battery systems sector has 105 members. With this in mind, I decided to create a global market-cap weighted index to track the overall performance of the sector. Out of the 105 companies my index ended up containing 71 members, I factored out companies with bad data and Energizer. I factored out Energizer because of their large market cap, and since as far as I know they are not developing any automotive related battery products. The average market cap of the index totaled USD225.38mn, with BYD co Ltd of China (1211 HK Equity) having the highest market cap of USD2.6bn (16.4% of index). See the chart below for more details.

Index Components with Weighting

Source: Bberg

I now wanted to compare the performance of the index against the S&P500 and WTI prices. To do this I used daily prices and rebased all the prices to 100 on 8/2/2007 (see charts below):

The Global Battery Index has Outperformed the S&P500

Source: Bberg

The Global Battery Index has a Positive Correlation with WTI Prices

Source: Bberg

As you can see from the charts above the global battery index easily out-performed the S&P500 and shows a strong positive correlation to WTI prices. This implies that if energy prices continue to rise or remain elevated we could continue to see the battery outperform the S&P500 as battery related demand increases.

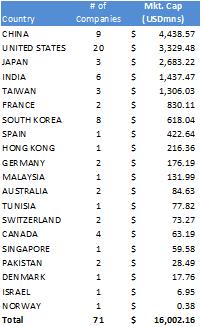
Once this was complete, I geographically broke out the companies. 20 of the 71 companies in the index are located within the US, followed by China with 9, South Korea with 8, and India with 6 (see chart below for more details):

The Top 5 Countries make-up 83% of the Market Cap

Source: Bberg

As you can see from the chart above China, the US, Japan, India, and Taiwan together make-up roughly 83% of the total market cap, while containing 58% of the total companies. To further assist this analysis I created country specific indices to compare against the benchmark; at first I found the results surprising.

Chinese Battery Index

American Battery Index

Japanese Battery Index

Indian Battery Index

Taiwanese Battery Index

*Source: Bberg for all charts

Relative to the overall battery index it is clear that Japan was a significant out-performer. This I believe can partially be explained by the fact that Japan imports nearly 100% of its oil, which among other factors, has led the government to announce oil and gas suppliers will be required to increase the use of renewable energy resources. The government's pro-active approach coupled by the fact that Japanese automakers, such as Honda and Toyota, seem to be on the forefront of hybrid technology should continue to bolster Japanese demand for battery related products. The three Japanese companies included in the index are GS Yuasa Corp, NPC Inc, & Shin-Kobe Electric Machinery Co. Mitsubishi Motors setup a joint venture with GS Yuasa corporation in Dec. 2007 to provide lithium-ion batteries starting in April 2009. According to Bberg, Shin-Kobe was recently rated a buy from Nomura Holdings Inc. who cited an increasing demand for batteries.

Will the other countries within the index follow suit? I beleive so, but further analysis would be needed to isolate specific equities best positioned to take advantage of the potential increase in demand, and I am not in the habit of recommending specific equities on this blog. The bottom line is, as long as oil prices remain elevated we should continue to see increased demand for battery related products as automakers begin moving towards more hybrid and PHEV technology.