Due to Popular Demand Fiat Economics is Expanding and has moved to its own Domain:

Saturday, November 8, 2008

The Baltic Dry Index Revisited

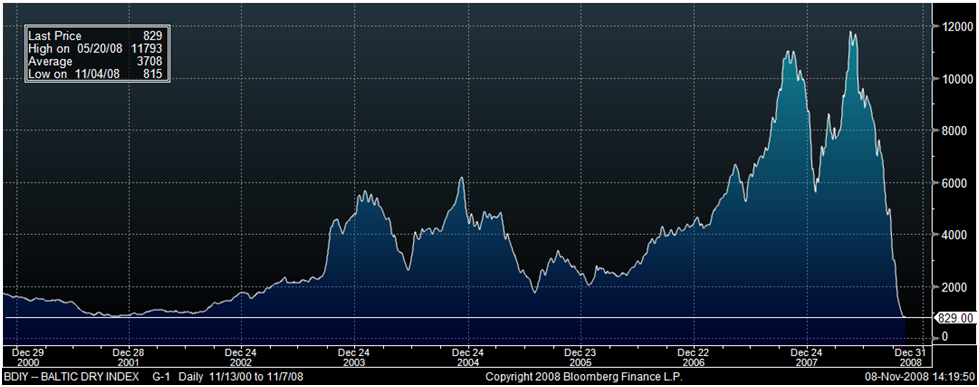
I have been receiving a significant amount of email regarding an old entry I wrote back in March 2008 regarding the Baltic Dry Index (BDI). Back in March the BDI was recovering for an interim low it experienced in January on fears of a global economic slowdown, however, since then the situation has become far worse. The BDI is now trading at levels not seen since 2001. To help put this into perspective a recent article by “The Independent” noted that in the beginning of June the total cost of a shipment of coal from Brazil to China would have totaled USD15mn per voyage compared to USD1.5mn currently. At the same time, the article noted that the daily cost of chartering a capsize bulk carrier during this cycle's peak amounted to USD234.0K vs. USD5.6K presently. This is a drop of around 98%!

The Baltic Dry Index's recent plunge
Source: Bloomberg

Now on to what is important… Why has this happened? Unlike the drop the index experienced earlier this year, based primarily over concerns of a global economic slowdown; the current plunge also takes into account the ongoing liquidity crisis and commodity deflation. The shipping industry relies heavily on an instrument called “Letters of Credit” (LC), which is a guarantee issued by a bank that the buyers funds will be transferred to the seller at the completion of the transaction (i.e. traded goods properly received). As liquidity tightened around the world so has the issuance of these instruments, further slowing global trade. According to Trade Finance Magazine to cope with this, the market has begun to see a resurgence in export credit (i.e. the seller issues loan to the buyer via an export credit agency), but as the magazine pointed out this is a “relatively slim corridor”, and holds significantly more risk for the exporter compared to a traditional LC.

As if this alone were not bad enough it would appear that deflation in commodity prices has caused many companies to begin using up raw material inventories rather than importing new stocks. This is basic economics, why buy something today that will be cheaper tomorrow? Nonetheless, these industries will eventually run low enough on inventories where they will be forced to purchase more, which should put some upward pressure on shipping costs.

The CRY Commodity Index has also dropped significantly
Source: Bloomberg

If prolonged this ’suspension’ in global trade will have significant adverse effects for export oriented economies, and increase the likelihood of further reductions to 2009 growth rates . Nonetheless, I do believe that as companies run low on inventory and as global credit markets continue to unlock we will see a stabilization and marginal recovery in shipping costs. However, it is unlikely we will see BDI levels anywhere close to those at the beginning of this year anytime before the end of this decade. In the short-term yet another piece of negative news for the global economy...

As an aside I created a monthly market cap weighted shipping index starting in May 2005 to compare against the BDI. I used the following companies for the index 1) AP Moller - Maersk 2) Mitsui OSK Lines 3) China Shipping Development Co 4) Nippon Yusen 5) Kawasaki Kisen Kaisha 6) Evergreen Marine Corp 7) Orient Overseas International 8) Neptune Orient Lines 9) Hanjin Shipping Co. & 10) CSC Nanjing Tanker Corp. Maersk alone makes up roughly 50% of the total market vap of the index.

Global shipping companies could continue to face downward pressure until the BDI begins to moderate.
Source: Bloomberg

Monday, November 3, 2008

A Graphical Look at October's Senior Loan Officer Survey:

Back in January I did a piece discussing the predictive power of the Senior Loan Officer Survey, and found that there was some significance to the data. For the survey banks’ senior loan officers are asked to answer multiple questions based on their lending standards and demand for commercial/residential loans as well as consumer loans. The survey is conducted during the first month of the applicable quarter. (i.e. Q108 data is collected during Jan. 2008) This more or less implies the data has a forward looking aspect, since the applicable quarter has only begun when the data is collected. This data is reviewed by the Federal Reserve for conducting monetary policy.

Unfortunately, the October 2008 survey doesn’t look much better than it did back in January. Lending standards have continued to tighten and demand has diminished. Currently, the survey concurs with the view that US economy is in a recession, which shows no immediate signs of abating. Here is a quick outline on where the survey can be important in analyzing future trends:

Non-residential Investment:

We found that the strongest relationship exists between non-residential investment and the data in the survey related to the number of banks tightening lending standards to businesses , businesses' demand for lending, and the cost of lending. In fact, the correlation between this data and non-residential investment is strong enough to pass-through to overall real GDP growth, but as you would expect with a smaller magnitude. We found that the reason for the relationship is because the level of business lending drops when costs and lending standards increase and demand drops, all of which are measured in the survey. Presently, all of these indicators point towards continued deterioration of non-residential investment.

Residential Investment:
We also found that the lending standards and demand for mortgages data is correlated with residential investment, although not at the same significance as business lending with non-residential investment. We found the strongest result between residential mortgage demand and residential investment, but unlike the non-residential relationship it was not strong enough to pass-through to overall real GDP growth. Nonetheless, without a loosing in lending standards it is unlikely we can see a sustained recovery in the US housing sector.

Personal Consumption Expenditure:
Unfortunately, historically we did not find any significant relationships. However, there has never been an instance over the available time series where credit card and consumer loan lending standards have increased by the magnitude we are currently experiencing. With this said, I do expect this to continue having a negative impact on consumer spending.

Here is the Data:

Net Percentage of Domestic Respondents Tightening Standards for C&I Loans
Notes: This graph would imply a continued slowdown for non-residential investment. Also interesting to note but not represented in this data is that many banks not only increased lending standards, but also reduced the maximum size and maturities on loans to all sized of businesses.

Net Percentage of Domestic Respondents Increasing Spreads of Loan Rates over Banks' Cost of Funds
Notes: Like the graph above, this graph also implies a continued slowdown for non-residential investment.

Net Percentage of Domestic Respondents Reporting Stronger Demand for C&I Loans

Notes: This graph implies that demand for business loans has not collapsed bu has shown signs of slowing. This is likely due to businesses requiring less credit to finance equipment, plant, and inventory expansions: Again pointing to a slow down in the business sector.

Commercial Real Estate Market
Notes: This graph implies there could be further deterioration in the commercial real estate market.

Net Percentage of Domestic Respondents Tightening Standards for Mortgage Loans
Notes: Lending standards for the residential mortgage sector continue to tighten. However, we did see marginal improvement for the prime mortgage sub-component.

Net Percentage of Domestic Respondents Reporting Stronger Demand for Mortgage Loans

Notes: After showing some signs of recovery demand for residential mortgages has once again begun to drop according to the survey.

Net Percentage of Domestic Respondents Tightening Standards on Consumer Loans
Notes: This graph implies tighter lending standards for credit cards and consumer loans could have an adverse effect on consumer spending. I agree with this assumption and do not see US GDP growth to move above trend until post 2010, mostly due to a decrease on consumer spending.


All in all in my opinion the implications of this survey are that things will get worse before they get better. Not only are tough times at hand for consumers, but also for businesses and the real estate sector. Over the next couple months, I expect we will see disappointing holiday sales, which should lead to lower than currently anticipated 4Q08 earnings and a prolonged period of below trend economic growth. This will likely continue to stoke the current volatility we have seen in the worlds' financial markets.

Friday, October 10, 2008

The Age of Despondency…

One could argue we have moved from an age of exuberance to an age of despondency. Not long ago our major concern was sky rocketing commodity prices, and its effect on global inflation; enter the credit crisis. We are currently witnessing an unprecedented global sell-off with no regards to asset classes or quality, or as I like to call it the age of despondency. We have achieved capitulation. One positive result of this is this action is that it was a necessary step to bring us out of these uncertain times. In the end we should establish a clear bottom, and eventually stage a sustained comeback. Important to highlight is that in this age of despondency many assets, regardless of quality, have been pulled down to interim lows. For example right now, you can purchase the 30 stocks that make-up the Dow and receive a 3.8% dividend, plus of course any appreciation or depreciation of the assets. I won’t even begin to get into the credit market…

Looking ahead, what will happen? Global governments have made it clear they are willing to take significant action to stem the adverse effects of this current crisis. However, markets have been acting faster than these governments can react. Nonetheless, it is important to keep in mind that government and especially monetary policy tend to work on a lag. We still have not realized the effects of the recent rates cuts, and more importantly the Troubled Assets Relief Program (TARP). It is extremely likely we will see an additional set of global rate cuts sometime in the near future. This despite the fact the real effect of these cuts won’t be immediately realized, nonetheless, the psychological effect will be immediate. And of course, given the unbiased sell-off across all assets and qualities, investor psychology has definitely played a major role in this sell-off.

I believe that current and potential future government/monetary policies will eventually lead to stabilization in global markets over the next couple months. Prior to this however we face what could be a volatile earnings season, poor holiday sales in the US, and what will likely be worsening economic news from the US and Europe. Also, downgrades to either Morgan Stanley or Goldman Sachs could significantly extend the current market uncertainty, and this should be monitored closely. Nevertheless, unlike developed nations which are facing both the credit crisis and an economic slowdown, for the most part emerging markets are only facing the latter. What does this mean? I believe that once markets stabilize Russia, China, & Brazil will likely benefit the most over the mid-term. These markets are all significantly off their highs, yet domestically are still experiencing relatively strong GDP growth. What we want to monitor in these markets is the ability of domestic demand to make-up for slowing export markets. As for the developed nations, especially the US, there will be a critical shift from what were major consumers to major savers; given the importance of consumption in these economies we will likely see Real GDP growth remain below trend through the rest of this decade.

Here are some basic trading ideas, however, these are only suggestions; I in no way advocate undertaking them. I personally am hesitant to make any moves until I see some easing in the credit markets and proof that the TARP and other policies have begun to unlock credit markets… There is without question some great values out there on an individual equity basis, but the real question is whether or not you have the capital to stay in the market for as long as the market remains irrational…

Cash:
Overweight Cash!
(at least until we see the credit markets stabilize)

Pair Trade:
Long US Staples / Short Luxury
(short to mid-term idea)

Commodities:
Overweight Grain
(long-term idea)
Overweight Livestock
(long-term idea)

Countries:
Overweight Russia/China/Brazil
(mid to long-term idea once credit markets settle)

Defensive:
You can always Long Gold, and potentially Short Platinum
Long Financial Ultrashort ETF
(potential hedge against Goldman or Morgan downgrade)

**Please email me for further ideas or questions:
Email Me

Wednesday, September 17, 2008

A Blast From the Past... How the Housing Crisis Will End (Revisited)

This piece is simply an updated version to a piece I published back on March 5th 2008 titled 'How will it end'. Despite the fact we are much deeper into this financial crisis; the root of the problem has not changed, and that is the US housing market.

As an interesting exercise consider that in March 2007 the total value of US subprime mortgage market was estimated at USD1.3trn; now lets combine that with the fact that 12% of these mortgages have or are in the process of defaulting. What this implies is that the total value of subprime mortgages effected by these foreclosures equals USD156bn. Now compare that to the cost of write-downs (~USD517bn) and the Fed's bailouts (USD85bn just for AIG)... Of course no one, including the Fed, could have possibly predicted the detrimental wide-spread effect the housing crisis would have on the global economy; my point is solely to demonstrate how a small piece can have a very significant impact on the entire picture in an over simplified manner.

Here it is with updated data and some small changes!

We are continuously being barraged with mixed news concerning the housing crisis. One day we hear signs are pointing towards a bottom; the next housing numbers came in much lower than expectations. So we raise this question: What indicators should we be looking at to truly signal a recovery in housing?

With this question in mind our analysis focused on creating the stages we believe would be necessary to facilitate a recovery. We were able to define 7 chronological stages which need to occur in order for the crisis to end. Additionally, the progress for each of the stages can be measured by several key indicators. The stages we outline below are meant to help to average investor better understand how a recovery will most likely unfold, and includes indicator that anyone with a basic internet connection will be able to easily access.

Our stages and key indicators to watch:

1. The number of defaults from subprime borrowers needs to drop substantially. This will help to stabilize growing inventory levels. Key Indicator(s): RealtyTrac foreclosure data (monthly) & MBA foreclosure data (quarterly)

Subprime ARM mortgage resets continue to be the primary driver behind subprime foreclosures (July 2007-November 2009)

Foreclosures as a percent of total mortgages continue to rise...
Source: Bloomberg

2. Banks need to lower lending standards for home mortgages. This will allow existing and new home sales to increase and prices to stabilize. Key Indicator(s): Fed Senior Loan Officer Survey, mortgage rates, Case Shiller Home price index (monthly), & New and Existing home sale prices

However, lending standards have tightened across all mortgage types according to the Senior Loan Officer Survey
Source: FRB

30Y fixed mortgage rates have fluctuated but remain elevated especially when considering the recent rate cuts ...
Source: Bloomberg

3. Once people are again able to buy homes we will see a reduction in inventory levels. When this occurs demand will rise for new constructions. Key Indicator(s): New home sales data (monthly) & Existing home sales data (monthly)

But for now increased foreclosures and tighter lending standards have caused new home sales to drop
Source: Census

The recent crisis has begun to negatively effect the housing affordability index
Source: Bloomberg

4. The rise in demand for new construction will first show up in building permits. The rise in building permits will lead to our next step... Key Indicator(s): Building permits data (monthly)

But, building permits have shown no signs of a sustained recovery
Source: Census

5. Very soon after the rise in building permits we will see an increase in housing starts. Key Indicator(s): Housing starts data (monthly)

However, with permits still depressed, starts have shown no signs of recovery
Source: Census

6. The increase in starts will lead to an increase in construction spending. Key Indicator(s): Construction Spending (monthly)

As you can see from this chart, this is not yet the case
Source: Census

7. Finally, residential investment begins to rise and the housing crisis is over. Key Indicator(s): Residential Investment via GDP release (quarterly)

Residential investment continues to be a drag on real GDP growth
Source: Bloomberg
Conclusion:

Essentially, this crisis is occurring due to a substantial increase in the supply of houses through subprime foreclosures, and a decrease in demand to buy houses through harder to get mortgages. As more homes enter the market and less people are able to acquire mortgages to by them the price drops. Hence, the first major step in a recovery for the sector will be a slow-down in the number of foreclosures, which has likely been pushed back until second half 2009. Secondly, and equally important banks need to reduce lending standards to allow qualified buyers to purchase new homes. These two actions combined will begin to reduce the inventory of homes on the market and stabilize price. Once the amount of inventory of homes for sale begins to drop, we will see demand for new constructions begin to rise. This will first show up in the building permits index, followed by housing starts, and finally private construction spending. All in all, this will not be a fast process, with the reduction in foreclosures and lowering of lending standards being the hardest hurdle to overcome.

Currently, the primary driver for subprime foreclosures are interest rate resets. When these borrowers we first given their mortgages they were given low teaser rates which would eventually reset into higher adjustable rates. Meaning some mortgage holders who were paying USD1,200 a month for their mortgage in November could be paying USD3,200 a month in December. For a lot of these borrowers it has been nearly impossible to pay the new amount and they have been forced to default. On a positive note, based on available market information we should see the number of resets for adjustable rate subprime mortgages peak sometime in late spring/early summer. However, it is tough to estimate the lag time between mortgage resets and actual foreclosures, which prolong this situation. The deteriorating employment situation in the US will add additional downward pressure to this indicator. All in all there is no quick easy fix on the housing front, and we will likely have to deal with these conditions for quite some time.

Investment Idea:
Once a the market starts showing signs of a sustained recovery we feel that US home builders could significantly benefit. US homebuilder stocks have been pounded since the housing crisis first began, and will be poised to make a recovery as demand for new homes eventually rises. However, as we said this could take some time, but it will happen. I currently hold a long position in ITB, a US home builder ETF.

Tuesday, September 16, 2008

My Thoughts on the Next 24 Hours...

These are very interesting times... At this point in time, after passing up some deals which could have saved AIG, I wouldn't be surprised if we saw at least part if not all of AIG being bought at bargain basement prices by one of its major competitors. I think it will be tough for them to find financing any other way, especially after the recent downgrades. However, I haven't been following the industry too carefully, so it would be tough for me to speculate on an appropriate suitor (list could include ING, Allianz, AXA, etc...). Nonetheless, I am rather glad I haven't taken on any new long positions in the sector recently. Something else we should all be paying close attention to is the effect these failures have on the CDS market, this could open up a whole new bag of worms. I recently read an article which stated that PIMCO alone currently guarantees USD760mn of AIG debt.

As for the Fed, I would be surprised, but not shocked, if we saw the Fed move 50bps today, however they will almost certainly switch to an easing bias in the statement and very likely modify and extend some of the current lending schemes (i.e. changes to the discount window and/or TAF, accepting more assets as collateral, possibly even allowing the Fed funds rate to trade well below target over the next couple of weeks, etc...). I don't really believe a rate cut would be the right course of action, liquidity is the issue not price. However, psychologically it may help the market. All in all the Fed's announcement will likely bring some calm to the market, which could easily be undone by an AIG collapse. We will all get a much better idea within the next 24 hours, as it has been reported an AIG deal would need to be completed by Wednesday. Currently, I am staying on the sidelines, but monitoring the situation closely. Finally, I did notice that the financial sector ultrashort ETF is trading nowhere near its July highs, which I found somewhat interesting. I am not very familiar with this fund, so if anyone has some insight on this please feel free to email me.

As an aside, and as I mentioned was a possibility in my previous post, China has begun easing monetary policy. This could be an important factor once the market does start recovering. Many of China's issues were self-inflicted and reversing policy could have a big impact as investors (eventually) become a bit less risk adverse.

UltraShort Financials ProShares (AMEX:SKF)


Source: Bloomberg

Sunday, September 14, 2008

A Quick Look at Global Sub-indices (& An Aside on China)

A while back I created an excel file that tracks the conditions of global sub-indices. Essentially, I took over 600 sub-indices from around the world and I broke them out by best and worst performing over the past 6 months, P/E and P/B ratios, and dividend yield. I extracted the 15 best and worst performing indices from each of these categories and consolidated them in the chart below . I am eventually planning on using this data to look at global trade ideas or to spot mis-pricings between markets. All in all I extracted this data form Bberg last week and I hope you enjoy the data. I will follow up with a more detailed analysis on markets that may look attractive after I conduct further research.

As an aside, given the recent economic data out of China (inflation, IP, exports, etc...), I anticipate the government is closer to moving towards a more accomodative monetary policy. The shift will likely include reductions in reserve requirements and an easing of lending standards. It is also possible, but unlikely at this point in time, that we could see a rate cut before the end of 2008. Any action by the government to stimulate the domestic economy should have positive effects on Chinese markets. I currently hold an upward bias towards some of China's housing, health care, and financial names. (Please see earlier posts for more details).


Top and Bottom 15 Global EQ Sub-Indices by 6M performance, PE, PB and dividend yield


*Source: Bloomberg

Monday, August 25, 2008

A Look at China’s P/E Ratios:

Quite a few readers have been wondering whether the relatively high P/E valuations of China’s equity markets were justified. This is my response: I would say that type of PE valuation is reasonable for most of the Chinese companies. As everyone knows, growth in China has been very robust over the past several years, and should remain strong over the next several, despite a slowdown in the rate of growth. To quickly quantify this argument we can take a look at the Shanghai SE Composite’s 2Q08 aggregate PE and divide that by China’s YoY GDP growth for the same period, and compare the data to against other markets (see chart below).

Select market PE's to underlying country's GDP growth

Source: Bloomberg


Looking at the chart above, despite China’s seemingly high PE valuations, in terms of PE to GDP they are actually the cheapest market in the set with a PE/GDP ratio of 2.1. Looking ahead, Chinese growth will continue outpacing its industrialized counterparts over the next several years, and this should help support its market. In fact, during this period we will likely see China’s domestic sector replace the export sector as the main engine of growth. This should partly be catalyzed by higher domestic incomes and growing domestic demand, coupled with a slowdown in consumption by industrialized nations. Of course from my experience, one of the big question marks for China’s market is the impact of any new government policies. However, given the expected weakness in the export sector, recent inflation moderation, and the slowdown of the GDP growth rate, I expect future policy to be accommodative to domestic growth.

Also, I will be traveling for the next couple of weeks, so I may be slow to post new entries. However, I will randomly be checking email.

Thanks!