Due to Popular Demand Fiat Economics is Expanding and has moved to its own Domain:

Saturday, November 8, 2008

The Baltic Dry Index Revisited

I have been receiving a significant amount of email regarding an old entry I wrote back in March 2008 regarding the Baltic Dry Index (BDI). Back in March the BDI was recovering for an interim low it experienced in January on fears of a global economic slowdown, however, since then the situation has become far worse. The BDI is now trading at levels not seen since 2001. To help put this into perspective a recent article by “The Independent” noted that in the beginning of June the total cost of a shipment of coal from Brazil to China would have totaled USD15mn per voyage compared to USD1.5mn currently. At the same time, the article noted that the daily cost of chartering a capsize bulk carrier during this cycle's peak amounted to USD234.0K vs. USD5.6K presently. This is a drop of around 98%!

The Baltic Dry Index's recent plunge
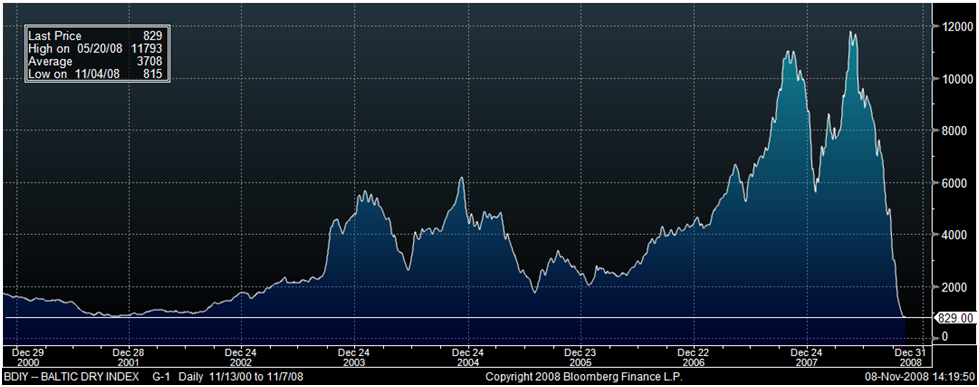
Source: Bloomberg

Now on to what is important… Why has this happened? Unlike the drop the index experienced earlier this year, based primarily over concerns of a global economic slowdown; the current plunge also takes into account the ongoing liquidity crisis and commodity deflation. The shipping industry relies heavily on an instrument called “Letters of Credit” (LC), which is a guarantee issued by a bank that the buyers funds will be transferred to the seller at the completion of the transaction (i.e. traded goods properly received). As liquidity tightened around the world so has the issuance of these instruments, further slowing global trade. According to Trade Finance Magazine to cope with this, the market has begun to see a resurgence in export credit (i.e. the seller issues loan to the buyer via an export credit agency), but as the magazine pointed out this is a “relatively slim corridor”, and holds significantly more risk for the exporter compared to a traditional LC.

As if this alone were not bad enough it would appear that deflation in commodity prices has caused many companies to begin using up raw material inventories rather than importing new stocks. This is basic economics, why buy something today that will be cheaper tomorrow? Nonetheless, these industries will eventually run low enough on inventories where they will be forced to purchase more, which should put some upward pressure on shipping costs.

The CRY Commodity Index has also dropped significantly
Source: Bloomberg

If prolonged this ’suspension’ in global trade will have significant adverse effects for export oriented economies, and increase the likelihood of further reductions to 2009 growth rates . Nonetheless, I do believe that as companies run low on inventory and as global credit markets continue to unlock we will see a stabilization and marginal recovery in shipping costs. However, it is unlikely we will see BDI levels anywhere close to those at the beginning of this year anytime before the end of this decade. In the short-term yet another piece of negative news for the global economy...

As an aside I created a monthly market cap weighted shipping index starting in May 2005 to compare against the BDI. I used the following companies for the index 1) AP Moller - Maersk 2) Mitsui OSK Lines 3) China Shipping Development Co 4) Nippon Yusen 5) Kawasaki Kisen Kaisha 6) Evergreen Marine Corp 7) Orient Overseas International 8) Neptune Orient Lines 9) Hanjin Shipping Co. & 10) CSC Nanjing Tanker Corp. Maersk alone makes up roughly 50% of the total market vap of the index.

Global shipping companies could continue to face downward pressure until the BDI begins to moderate.
Source: Bloomberg

Monday, November 3, 2008

A Graphical Look at October's Senior Loan Officer Survey:

Back in January I did a piece discussing the predictive power of the Senior Loan Officer Survey, and found that there was some significance to the data. For the survey banks’ senior loan officers are asked to answer multiple questions based on their lending standards and demand for commercial/residential loans as well as consumer loans. The survey is conducted during the first month of the applicable quarter. (i.e. Q108 data is collected during Jan. 2008) This more or less implies the data has a forward looking aspect, since the applicable quarter has only begun when the data is collected. This data is reviewed by the Federal Reserve for conducting monetary policy.

Unfortunately, the October 2008 survey doesn’t look much better than it did back in January. Lending standards have continued to tighten and demand has diminished. Currently, the survey concurs with the view that US economy is in a recession, which shows no immediate signs of abating. Here is a quick outline on where the survey can be important in analyzing future trends:

Non-residential Investment:

We found that the strongest relationship exists between non-residential investment and the data in the survey related to the number of banks tightening lending standards to businesses , businesses' demand for lending, and the cost of lending. In fact, the correlation between this data and non-residential investment is strong enough to pass-through to overall real GDP growth, but as you would expect with a smaller magnitude. We found that the reason for the relationship is because the level of business lending drops when costs and lending standards increase and demand drops, all of which are measured in the survey. Presently, all of these indicators point towards continued deterioration of non-residential investment.

Residential Investment:
We also found that the lending standards and demand for mortgages data is correlated with residential investment, although not at the same significance as business lending with non-residential investment. We found the strongest result between residential mortgage demand and residential investment, but unlike the non-residential relationship it was not strong enough to pass-through to overall real GDP growth. Nonetheless, without a loosing in lending standards it is unlikely we can see a sustained recovery in the US housing sector.

Personal Consumption Expenditure:
Unfortunately, historically we did not find any significant relationships. However, there has never been an instance over the available time series where credit card and consumer loan lending standards have increased by the magnitude we are currently experiencing. With this said, I do expect this to continue having a negative impact on consumer spending.

Here is the Data:

Net Percentage of Domestic Respondents Tightening Standards for C&I Loans
Notes: This graph would imply a continued slowdown for non-residential investment. Also interesting to note but not represented in this data is that many banks not only increased lending standards, but also reduced the maximum size and maturities on loans to all sized of businesses.

Net Percentage of Domestic Respondents Increasing Spreads of Loan Rates over Banks' Cost of Funds
Notes: Like the graph above, this graph also implies a continued slowdown for non-residential investment.

Net Percentage of Domestic Respondents Reporting Stronger Demand for C&I Loans

Notes: This graph implies that demand for business loans has not collapsed bu has shown signs of slowing. This is likely due to businesses requiring less credit to finance equipment, plant, and inventory expansions: Again pointing to a slow down in the business sector.

Commercial Real Estate Market
Notes: This graph implies there could be further deterioration in the commercial real estate market.

Net Percentage of Domestic Respondents Tightening Standards for Mortgage Loans
Notes: Lending standards for the residential mortgage sector continue to tighten. However, we did see marginal improvement for the prime mortgage sub-component.

Net Percentage of Domestic Respondents Reporting Stronger Demand for Mortgage Loans

Notes: After showing some signs of recovery demand for residential mortgages has once again begun to drop according to the survey.

Net Percentage of Domestic Respondents Tightening Standards on Consumer Loans
Notes: This graph implies tighter lending standards for credit cards and consumer loans could have an adverse effect on consumer spending. I agree with this assumption and do not see US GDP growth to move above trend until post 2010, mostly due to a decrease on consumer spending.


All in all in my opinion the implications of this survey are that things will get worse before they get better. Not only are tough times at hand for consumers, but also for businesses and the real estate sector. Over the next couple months, I expect we will see disappointing holiday sales, which should lead to lower than currently anticipated 4Q08 earnings and a prolonged period of below trend economic growth. This will likely continue to stoke the current volatility we have seen in the worlds' financial markets.