Due to Popular Demand Fiat Economics is Expanding and has moved to its own Domain:

Saturday, July 25, 2009

Economics Week Ahead: GDP & Earnings Steal the Show

We have a rather tumultuous week in terms of economic data, which will focus on the US housing sector, consumer confidence, durable goods, and US GDP. The week kicks off Monday morning with the US Census Bureau reporting June’s new home sales. Recent housing data has been indicative of a bottom for the sector, so it will be important to see whether new home sales data confirms this trend. Mid-week the market will focus on June’s durable goods, looking for any signs of a potential turnaround in industrial production, which experienced a 13.6%yoy decline in June. The week’s main economic event is taking place on Friday with the Commerce Department’s release of the advanced 2Q09 GDP estimates. They will also be releasing changes to the benchmark methodology, which could cause some revisions to past data. But again, this week’s earnings calendar will overshadow most of the week’s economic news. Big names reporting this week include Chevron, Walt Disney, Travelers, Verizon, Viacom, Exxon Mobile, Amgen, Norfolk Southern, Genco Shipping, DryShips, Visa, and International Paper. There will also be a record US$115bn long-dated Treasury auction occurring this week, which coupled with better than anticipated earnings has put some downward pressure on Treasury prices.

Monday July 27th:

10:00AM: New Home Sales (Risk: Upward, Market Reaction: Significant): Attractive mortgage rates combined with tax incentives and relatively low home prices should place some upward pressure on this release, but sustained weakness in the labor market will prevent this index from realizing its full potential. The current Bloomberg consensus for new home sales is 350K, compared to last month’s reading of 342K.

Tuesday July 28th:

7:45AM: ICSC-Goldman Store Sales (Risk: Negative, Market Reaction: Marginal): This weekly index tracks aggregate store sales across major US retailers, accounting for roughly 10% of total retail sales. Given recent data supporting an increasing US saving rates and a worsening employment situation, this index could face some downward pressure. Last week’s number indicated a 0.5% gain in store sales over the previous week.

10:00AM: S&P Case Shiller Home Price Index (Risk: Neutral, Market Moderate: xx): The S&P Case Shiller HPI is reported monthly, but on a two month lag. Last month’s report showed the rate at which home prices were declining began diminish, with some major cities even experiencing modest gains. I anticipate this month’s release will reaffirm that trend. But, we would still need to see significant improvements in those regions, which were the hardest hit by the drop in prices, before we can see a strong overall recovery.

10:00AM: Consumer Confidence (Risk: Downside, Market Reaction: Significant): Weakness in the labor market could adversely impact consumer confidence, overshadowing the recent spike in equity prices. Supporting this is the fact that last week’s Reuters/UofM Consumer Sentiment Index fell to 66 in July from 70.8 a month prior. It will also be important to monitor changes in the expectations index, which has remained elevated, and could help buffer any negative surprises in the current conditions index. The current Bloomberg consensus forecast for July’s consumer confidence reading is 50.0, versus an outcome last month of 49.3.

10:00AM: Janet Yellen, San Francisco Federal Reserve Bank President, speaks on the economic outlook to the Idaho/Oregon Bankers Association.

Wednesday July 29th:

7:00AM: MBA Purchase Applications (Risk: Neutral, Market Reaction: Marginal): This index, which tracks new mortgage applications tends to be a reasonable forward looking indicator for home sales, but issues including customers filling out numerous applications could skew the index. Last week the purchase index rose 1.3%; while the refinance index increased by 4.0% on rising, but still relatively low mortgage rates.

8:30AM: Durable Goods Orders (Risk: Downside, Market Reaction: Significant): This index could face some negative pressure this month as June’s ISM, Philly Fed, NY Fed indices all indicated contractions in new orders. The current Bloomberg consensus forecast is a month over month change of -0.5%, compared to last month’s reading of 1.8%. In May this index was down roughly 26%y/y.

8:30AM: William Dudley, New York Federal Reserve Bank President speaks to the Association for a Better New York on factors driving U.S. growth and inflation.

10:30AM: EIA Petroleum Status Report (Risk: Neutral, Market Reaction: Moderate): This report indicates domestic petroleum inventories, which could have a significant impact on the energy sector.

2:00PM: Fed Beige Book (Risk: Neutral, Market Reaction: Marginal): This report, which is released two weeks before FOMC meetings, outlines economic conditions across the Fed’s 12 districts. Indications of a return to growth for any of the fed’s districts could produce some positive headlines.

Thursday July 30th:

8:30AM: Jobless Claims (Risk: Downside, Market Reaction: Significant): As expected, initial claims experienced a significant uptick last week to 554K from 522K, after two solid weeks of declines. This increase will likely be continued this week as erroneous seasonal adjustments from early auto plant closures continue to correct themselves. Nevertheless, barring recent data, I due anticipate we will see a modest recovery in claims data over the coming months.

10:00AM: EIA Natural Gas Report (Risk: Neutral, Market Reaction: Moderate): This report highlights domestic natural gas inventories, which could have a significant impact on the energy sector.

4:30PM: Fed Balance Sheet & Money Supply (Risk: Neutral, Market Reaction: Marginal): Since the Fed’s shift to quantitative easing, the balance sheet has become one method to measure to the Fed’s effectiveness. The market will pay close attention to the reserve bank credit component, which measures factors supplying providing reserves into the banking system. Last week the Fed’s balance sheet decreased to US$2.024trn from US$2.057trn. The fed’s balance sheet has slowly been shifting away from emergency lending facilities to Treasuries, agency debt and mortgage-backed securities to help bring down interest rates.

Friday July 31st:

8:30AM: GDP (Risk: Neutral, Market Reaction: Significant): This will be the key release for the week as investors continue trying to gauge the longevity of the current recession. The current Bloomberg consensus forecast for Real GDP (Q/Q) SAAR is -0.7%, compared to a prior reading of -5.5%. Additionally, the Commerce Department will be releasing their benchmark revisions, which could cause some revisions to past data. In the eyes of the market, this release will likely support the view that there is light at the end of the tunnel. But, make no mistake about it, we are still in the midst of a prolonged recession, which though easing likely won’t abate over the next several months. This data will also reaffirm the Central Bank’s current accommodative policy stance.

8:30AM: Employment Cost Index (Risk: Downside, Market Reaction: Marginal): The current Bloomberg consensus forecast for the ECI is a quarter over quarter change of 0.3%, compared to a first quarter reading of 0.3%. Interestingly, last quarter’s growth rate was the lowest in the 27 year history of this index. Weakness in the labor market combined with cost cutting, affecting benefits, could place some additional downward pressure on this index.

9:45AM: Chicago PMI (Risk: Neutral, Market Reaction: Moderate): The current Bloomberg consensus forecast for the Chicago PMI Business Barometer Index is 44, versus June’s reading of 39.9. Any reading below 50 indicates a contraction. This index includes both manufacturing and non-manufacturing companies. It will be important to monitor the new orders, employment, and prices paid indices, all of which are currently well below the breakeven of 50.

3:00PM: Farm Prices (Risk: Neutral, Market Reaction: Marginal): Given the relationship between farm prices and food prices, this index could have implications on future headline CPI and PPI.

Enjoy the weekend!

Friday, July 24, 2009

Consumer Sentiment Falls on Jobs Weakness

The Reuters/University of Michigan consumer sentiment index dipped for the fist time in five months to 66, compared to a market consensus of 65 for July. At the same time the July expectations index increased to 63.2 versus July's preliminary reading of 60.9. The drivers behind this month's declines were derived from weakness in the labor market and wages. This reading implies that consumers remain concerned over the current economic conditions, and will likely keep spending restrained until a brighter outlook for the employment situation emerges.

Thursday, July 23, 2009

Existing Home Sales Beat Estimates, Rise 3.6%

US existing home sales came in above the market consensus, rising 3.6% at an annualized rate of 4.89mn. Single family home sales increased by 2.4%, while condo/coop sales increased 14.0%. The months supply of home also improved moving to 9.4 months, compared to 9.8 in May. The median home price rose 4.1%, but still remains negative on a yearly basis. All in all, low prices combined with attractive mortgage rates are helping to stabilize the housing sector.

On a personal note, I was recently speaking to a developer in Boston who said business is once again picking up, but without private financing taking on new projects could be tough. He indicated that local banks were still hesitant on financing new deals, even in cases were the relationship has spanned decades. However, he is still working on several projects in Cambridge, and seems cautiously optimistic about the future.

Initial Claims Climb 30K to 554K

As I anticipated, and explained in my US Week Ahead, initial claims experienced a significant uptick this morning, which will likely be continued next week. In reality, this increment was probably due to a correction in what has been overly optimistic data stemming from erroneous seasonal adjustment factors.

Fed Chairman Bernanke in his recent testimony to Congress discussed the fact that weakness in the jobs sector and housing market will continue to be an Achilles heel for a US economic recovery. But, I anticipate that, excluding the anomalous data over the past three weeks, claims will slowly begin to improve. However, given such a weak base and initial claims forward looking ability to predict payrolls, it is very probable the overall employment situation will still get worse before it gets better. The unemployment rate likely to move above 10%. Typically, an initial claims level of around or below 350K would lead to increases in payrolls, but we are still far from those levels.

US Initial Claims

Source: St Louis FRED

Monday, July 20, 2009

Leading Indicators Up: A Good Sign for the Economy

The index of leading indicators was up in June by 0.7%, or slightly above the market consensus of 0.5%. At the same time May's number was revised up to 1.3% from 1.2%. This is the third consecutive month of gains for the index. In the release the Conference Board was quoted as saying, "The behavior of the composite indexes suggest that the recession will continue to ease and that the economy may begin to recover in the near term." The LEI tends to be a good forward looking indicator towards industrial production and the ISM. Seven out of ten of the LEI sub-components were positive for the month with the biggest gains coming from the yield curve and building permits; while money supply was the weakest component. The Conference Board also released June''s coincident and lagging indices, both of which were down.

Friday, July 17, 2009

US Economic Week Ahead: Cue Earnings

After last week’s barrage of economic data, this week is relatively light. The few exceptions will be Monday’s leading indicator release, Thursday’s jobless claims and existing home sales data, and Friday’s consumer sentiment report. This week’s claims data will likely take on added importance as the market tries to decipher the impact early auto plant shutdowns may have had on the index’s seasonal adjustment factors, leading to better than expected claims data over the past couple weeks. Additionally, starting on Tuesday Fed Chairman Ben Bernanke will deliver his semi-annual monetary policy testimony to House Financial Services Committee, which will almost certainly generate some headlines. But, earnings will again steal the spotlight this week with roughly 33% of the companies in the DJI and 25% of the S&P500 set to report. Some of the major names include Apple, Microsoft, Boeing, Caterpillar, UPS, Morgan Stanley, Yahoo, EBay, Amazon, Texas Instruments, and Advanced Micro Devices.

Monday July 20th:

10:00AM: Leading Indicators (Risk: Neutral, Market Reaction: Maringal/Moderate): The leading indicators index is a composite index of ten economic indicators considered to be forward looking to economic activity, these include among others jobless claims, building permits, stock prices and the University of Michigan expectations survey. The index climbed in both May and April by 1.2% and 1.1%, respectively. The market is currently anticipating a 0.5% increment in June’s release.

Tuesday July 21st:

7:45AM: ICSC-Goldman Store Sales (Risk: Negative, Market Reaction: Marginal): This weekly index tracks aggregate store sales across major US retailers, accounting for roughly 10% of total retail sales. Given recent data supporting an increasing US saving rates and a worsening employment situation, this index could face some downward pressure. Last week’s number indicated a 0.9% decline in store sales over the previous week.

8:30AM: Chicago Fed National Activity Index (Risk: Neutral, Market Reaction: Marginal): The CFNAI is an index of 85 separate data sets designed to represent national economic activity and inflationary pressure. A reading of 0 indicates the economy is growing at the historical trend while a negative or positive result indicates the economy is growing below or above its historical average, respectively. Given the volatile nature of this index the three month moving average is typically quoted. This index remains somewhat obscure in the mainstream media and is likely to have a minimal impact on trading. I anticipate that we will see a marginal improvement from last month’s reading of -2.67 based on improving economic data,

10:00AM: Fed Chairman Ben Bernanke delivers his semi-annual monetary policy testimony to House Financial Services Committee

Wednesday July 22nd:

7:00AM: MBA Purchase Applications (Risk: Neutral, Market Reaction: Marginal): This index, which tracks new mortgage applications tends to be a reasonable forward looking indicator for home sales, but issues including customers filling out numerous applications could skew the index. Last week the purchase index fell 9.4%; while the refinance index increased by 18.0% on the back of relatively low mortgage rates.

10:00AM: Fed Chairman Ben Bernanke delivers his second day of semi-annual monetary policy testimony to House Financial Services Committee

10:30AM: EIA Petroleum Status Report (Risk: Neutral, Market Reaction: Moderate): This report indicates domestic petroleum inventories, which could have a significant impact on the energy sector.

Thursday July 23rd:

8:30AM: Jobless Claims (Risk: Downside, Market Reaction: Significant): After two consecutive weeks of positive surprises, stemming from what was likely erroneous seasonal adjustment factors caused by early auto plant shut downs, we will likely see a correction. The current Bloomberg consensus stands at 560K compared to last week’s reading of 522K.

9:30AM: Fed Governor Daniel Tarullo testifies to the Senate Banking Committee, FDIC, and SEC on regulatory restructuring

10:00AM: Existing Home Sales (Risk: Downside, Market Reaction: Moderate/Significant): The Bloomberg consensus for existing home sales stands at 4.850 compared to last month’s reading of 4.770. It will be important to watch the inventory levels, which last month declined to 9.6 months from 10.1 months, the month prior. But, a recent article in the WSJ highlights the fact that a glitch in the California Association of Realtors computer system may have been inflating the number of homes sold in San Diego over the past several months, which means we will likely see some downward revisions.

10:00AM: EIA Natural Gas Report (Risk: Neutral, Market Reaction: Moderate): This report highlights domestic natural gas inventories, which could have a significant impact on the energy sector.

4:30PM: Fed Balance Sheet & Money Supply (Risk: Neutral, Market Reaction: Marginal): Since the Fed’s shift to quantitative easing, the balance sheet has become one method to measure to the Fed’s effectiveness. The market will pay close attention to the reserve bank credit component, which measures factors supplying providing reserves into the banking system. Last week the Fed’s balance sheet increased by US$34.2bn to move back above US$2 trillion.

Friday July 24th:

10:00AM: Consumer Sentiment (Risk: Neutral, Market Reaction: Significant): Rising stock prices and receding energy prices should bode well for this index, but could be offset by continued weakness on the labor front. The current Bloomberg consensus for July’s final consumer sentiment index is 65.0 compared to mid-July’s reading of 64.6.

Enjoy the weekend!

June Housing Starts Show Big Gains

June housing starts came in this morning well above expectations increasing 3.6%, totaling 582K (SAAR) units. Economists has been anticipating 530K. This is the index's second consecutive month of gains, which could indicate some stabilization for the sector. There were also some positive revisions to April's and May's starts numbers. The increase was due to a 14.4% increment in single-family home starts, while multi-family housing starts actually declined by 25.8%. Regionally, the South experienced the largest increase in starts with a gain of 13.9%, while the West was the weakest with a gain of only 1.9%. Housing permits were up 8.7% in June. Overall this is a positive report for the housing sector, but we will need to see significant improvements in the level of foreclosures and the supply glut currently on the market prior to any true recovery.

Thursday, July 16, 2009

Philly Manufacturing Index Declines More Than Expected

The Philadelphia Fed Manufacturing Index fell to -7.5 this month compared to -2.2, last month. Looking deeper into the details, the future general activity index remained positive, but declined to 51.9 from 60.1 last month. Further deterioration to this component could indicate continued weakness in in the general business activity index through the beginning of 2010. This manufacturing index is highly correlated with both ISM and industrial production.

The prices paid index increased to -3.5 from -13.0 a month prior. New orders moved to -2.2 from -4.8 a month prior, any reading below 0 indicates a contraction. The labor market conditions index continued facing pressure coming in at -25.3, compared to -21.8 in June.

I believe we are likely still far off from any sustained recovery in the manufacturing sector. But, the worst is behind us.

Jobless Claims Drop, But Reading is too Optimistic

As I mentioned was a likely scenario in my US Economic Week Ahead, jobless claims fell 47K to 522K. As with last week, early auto company layoffs have likely distorted the index due to misaligned seasonal adjustments. I do believe we should continue to see an improvement in jobless claims, but the levels seen over the past two weeks are too optimistic. Thus, I believe over the next several weeks this issue will begin to correct itself, and we will start to experience what appears to be an increase in jobless claims. The market places a lot of importance on the initial claims number as it is an excellent forward looking indicator to payrolls.

Continuing claims experienced a record drop of 642K to 6.915mn. But, this too was likely a one off event caused by statistical factors.


Wednesday, July 15, 2009

Empire Survey and Industrial Production Surprise to the Upside

The Empire State Manufacturing Survey's General Business Conditions Index moved up to -0.6 from -9.4 in June. Both the new orders and shipment indices came in above 0 this month, indicating growth, at 5.9 and 11.0, respectively. But, the employment index remained depressed with a reading of -20.8, almost unchanged from the prior month. It will be important to see if the Philly survey, being released tomorrow shows similar results.

June's Industrial production came in above analysts' expectations this morning, despite a decline of 0.4%. As I expected manufacturing experienced the largest drop of 0.6% followed by mining with a decline of 0.5%. Utilities posted a gain of 0.8%. Capacity utilization set a new historic low for the index finishing the month at 68.0%.

Tuesday, July 14, 2009

Retail Sales Jump, but the Story is in the Details...

Retail sales jumped 0.9% last month on the back of higher gasoline prices and increased automobile purchases. Automobile sales were mostly catalyzed by bigger incentives to clear inventories. But, factoring out these components retail sales would have actually declined for the 4th consecutive month. Therefore, despite what appears to be a significant increment on the surface, the details behind this morning's data do not yet indicate a recovery for the sector. Finally, consumers' purchases were centered around basic necessities such as food and gas versus discretionary goods.

Please click here for his week's full economic calendar with analysis and expectations.

Saturday, July 11, 2009

US Week Ahead: A Hectic Week on Data & Earnings

Despite a rather hectic week of economic releases; earnings news will likely steal the show this week. Big names on the earnings calendar this week include Goldman Sachs, JPMorgan, Bank of America, Citigroup, GE, Intel, Google, IBM, and Johnson & Johnson. However, a recent mixture of good and bad economic news, including decreasing consumer sentiment, rising unemployment, and dreadful retail sales have raised concerns over the potential for a prolonged recession. Therefore, it’s important we pay close attention to Tuesday’s retail sales and PPI data, Wednesday’s CPI and industrial production data, and finally Thursday’s jobless claims number, all of which have the potential to move the market in one direction or another. Here is the remainder of the calendar:

Monday July 13th:

2:00PM: Treasury Budget (Risk: Upside, Market Reaction: Marginal): The current Bloomberg consensus for the Treasury’s monthly budget report is –US$97bn compared to –USD187.7bn a month prior. These large deficits have been fueled by TARP expenditures and buying federal housing agency debt. But, several companies have recently paid back TARP funds, which will likely reduce the level of this month’s deficit.

Tuesday July 14th:

7:45AM: ICSC-Goldman Store Sales (Risk: Downside, Market Reaction: Marginal): This weekly index tracks aggregate store sales across major US retailers, accounting for roughly 10% of total retail sales. Given recent data supporting an increasing US saving rates and a worsening employment situation, this index could face some downward pressure. Last week’s number indicated a 0.1% increment in store sales over the previous week.

8:30AM: Producer Price Index (Risk: Downside, Market Reaction: Moderate/Significant): Higher energy prices and a small increment in food prices will likely lead to a higher headline number for the PPI, while core-PPI should remain relatively unchanged. According to Bloomberg the current consensus forecast for the PPI and core-PPI is 0.8% and 0.1%, respectively. Any significant upward surprise in this index could amplify rhetoric among inflation hawks. This index is considered a forward looking indicator to profits and the CPI.

8:30AM: Retail Sales (Risk: Neutral, Market Reaction: Significant): The effect of higher gasoline prices in June could cause retail sales to surprise to the upside. But, factoring out gas, recent weakness in other sales indicators imply that June’s sales data will be flat to negative. According to Bloomberg the current market consensus for retail sales and retail sales-ex autos is 0.5% and 0.6%, respectively. Retail sales plunged at the end of last year and have essentially remained flat this year.

10:00AM: Business Inventories (Risk: Neutral, Market Reaction: Marginal): On the back of a decline in wholesale inventories, business inventories will likely decline again in June after declining the previous eight months. Look for auto and retail inventories to continue their decline. According to Bloomberg the current market consensus for business inventories is a monthly change of -0.8%. The good news is that with inventory levels so low once a recovery does begin we could see a jump in manufacturing as companies look to replenish their stocks.

Wednesday July 15th:

7:00AM: MBA Purchase Applications (Risk: Neutral, Market Reaction: Marginal): This index, which tracks new mortgage applications tends to be a reasonable forward looking indicator for home sales, but issues including customers filling out numerous applications could skew the index. Last week the purchase index rose 6.7%, while the refinance index increased by 15.2% on the back of relatively low mortgage rates.

8:30AM: Consumer Price Index--CPI (Risk: Downside, Market Reaction: Significant): As with the PPI, a recent rise in energy prices will likely add some upward pressure on the headline index, while core CPI should remain relatively constant relative to last month. According to Bloomberg the current consensus forecast for the CPI and core-CPI is 0.7% and 0.1%, respectively. Any significant upward surprise in this index could amplify rhetoric among inflation hawks; the inverse is true with a downward surprise.

8:30AM: Empire State Manufacturing Survey (Risk: Downside, Market Reaction: Marginal): This index tracks manufacturing activity in New York state across 175 different companies in a variety of industries. Recent weakness in the overall manufacturing sector will likely add some downside pressure to July’s release. According to Bloomberg, the current market consensus for the general business conditions index is -4.5, compared to -9.4 a month prior. It will be important to monitor the general business conditions, new orders, and prices paid components of the index, all of which were negative last month. Conversely, the future general business conditions index rose last month.

9:15AM: Industrial Production (Risk: Downside, Market Reaction: Significant): Continued weakness in manufacturing sector will likely add downward pressure to the overall index. According to Bloomberg, the current market consensus for June’s IP is a monthly change of -0.7% with a capacity utilization rate of 67.8%. In June capacity utilization stood at 68.3%, or 12.6% below its 1972-2008 average.

10:30AM: EIA Petroleum Status Report (Risk: Neutral, Market Reaction: Moderate): This report highlights domestic petroleum inventories, which could have a significant impact on the energy sector.

2:00PM: FOMC Minutes (Risk: Neutral, Market Reaction: Marginal): Given the three week lag between the FOMC meeting and the release of the minutes this should have only a marginal effect on trading. But, the minutes could elaborate the rationale behind the FOMC’s decision, and give some clues to future decisions, in which case the market could move on the release.

Thursday July 16th:

8:30AM: Jobless Claims (Risk: Upside, Market Reaction: Significant): Last week’s better than expected initial jobless claims may have been exaggerated by inaccurate seasonal adjustment factors stemming from the timing of automotive and other manufacturing lay-offs, which could be repeated this week. According to Bloomberg the current consensus for initial jobless claims stand at 535K, compared to 565K last week. Although, I do believe we will continue to see a downward trend in the number of new claims, the level last week's number implied is too optimistic.

9:00AM: Treasury International Capital Data (Risk: Neutral, Market Reaction: Marginal): This data highlights the flow of financial instruments to and from the US. Thus, indicating foreign demand for US financial instruments, which tends to have a stronger impact on the dollar and bond markets compared to equities.

10:00AM: Philly Fed Survey (Risk: Downside, Market Reaction: Moderate): This index, which tracks manufacturing activity within the Philly Fed’s district, is correlated to both the ISM and Industrial production indices. According to Bloomberg the current market consensus for the general business conditions index is -5.0 versus -2.2 a month prior. Continued weakness in manufacturing will likely place downward pressure on this index.

10:00AM: EIA Natural Gas Report (Risk: Neutral, Market Reaction: Moderate): This report highlights domestic natural gas inventories, which could have a significant impact on the energy sector.

1:00PM: Housing Market Index (Risk: Downside, Market Reaction: Moderate): The housing market index, published by the National Association of Home Builders, indicates the demand for housing combined with consumer sentiment towards the housing market. The index is calculated by using a weighted average of the following indices; present sales of new homes, sale of new homes expected in the next six months, and traffic of prospective buyers in new homes. Increasing unemployment coupled with waning consumer confidence could place some downward pressure on this index.

4:30PM: Fed Balance Sheet & Money Supply (Risk: Neutral, Market Reaction: Marginal): Since the Fed’s shift to quantitative easing, the balance sheet has become one method to measure to the Fed’s effectiveness. The market will pay close attention to the reserve bank credit component, which measures factors supplying providing reserves into the banking system. Last week the Fed’s balance sheet shrunk to $1.977 trillion from $1.989 trillion the previous week.

Friday July 17th:

8:30AM: Housing Starts (Risk: Downside, Market Reaction: Marginal/Moderate): After experiencing an unexpected bump in May housing starts are likely to decline in June. According to Bloomberg the current market consensus for starts is 530K, compared to 532K last month. Weak demand for homes will likely place downward pressure on this index.

Have a good weekend!

Friday, July 10, 2009

China's June Exports Fall 21.4%y/y in June

Chinese exports continued struggling in June falling 21.4% y/y compared to analysts' estimates of 21.0%, and a 26.4% y/y drop in May. Continued declines in exports are being offset by increased domestic demand, which is heavily bolstered by the country's stimulus package. According to Bloomberg, China's Premier Wen Jiabao believes the foundation for China's economic recovery is not yet set and they will continue on a course of easy monetary policy and pro-active fiscal policy.

A continued decline in Chinese exports is a bad omen for shipping rates. Shipping rates over the last several months have been supported almost exclusively by China's record importation of raw materials. Without a return of global demand for Chinese goods, many of these raw materials are just sitting in inventories one way or another. Thus, it is highly likely that China's demand for raw materials will begin to wain. But, presently it appears Chinese iron imports rose 3.4% in June to 55.3mn tons. However, this could be caused by a lag effect of massive congestion of vessels waiting to unload off the coast of China, or possibly increased imports from India via land. Supporting this view is that one of China's primary ports actually reported a 12% drop in ore imports from the previous month. In either case, I anticipate that this number will fall in the coming months.

Thursday, July 9, 2009

Initial Claims Come in Better than Expected

Initial Claims finished came in this morning at 565K versus the previous week's reading of 614K and a consensus forecast of 610K. I believe the improvement may have been exaggerated by inaccurate seasonal adjustment factors stemming from the timing of automotive and other manufacturing lay-offs, which could be repeated next week. Although, I do believe we will continue to see a downward trend in the number of new claims, the level this week's number (and possibly next week's) indicates is too optimistic.

Conversely, continuing jobless claims rose 159,000 to a high of 6.883mn. This increase is primarily due to the lag effect of recently high initial claims coupled with the fact that the unemployed workforce has been unable to find new jobs.

Wednesday, July 8, 2009

Alcoa's Earnings Come in Above Consensus Estimates

Kicking of the 2Q09 earnings season Alcoa (AA) reported a loss yesterday of US$0.26/share compared to analysts’ average estimate of US$0.38/share. The company accredited the better than expected result to workforce reductions and production cuts. CEO Klaus Kleinfeld said in a statement, “Alcoa has the staying power and reduced cost base to withstand the most serious downturn in the history of the aluminum industry.” Alcoa showed marginal gains in after-hours trading on the news.

MBA Purchase Applications Composite Index Up 10.9%

The MBA The Market Composite Index rose 10.9% the week ending July 3rd 2009. The purchase index rose 6.7%, while the refinancing component climbed 15.2%, on the back of relatively favorable interest rates. Remember this index could be skewed by lenders filling out multiple applications, and I would like to see a continued trend in the index before rushing to any conclusions on the housing sector. The 4wk moving average of the market index is still down by 5.6%.

Tuesday, July 7, 2009

ICSC-Goldman Store Sales-- Shows Growth, But Redbook Says Otherwise

ICSC-Goldman Store Sales demonstrated a week over week increase of 0.1% and a year over year increase of 0.5% during the holiday week. This likely won't have much effect on today's trading. But, the Redbook, which was released at 8:55AM showed a 4.2% y/y decline in same store sales, which continues to indicate the retail sector remains depressed. Chain stores will be reporting sales later this week.

ICSC-Goldman Store Sales
Source: Bloomberg

Redbook Results:
Year-over-year: Week (w/e 7/04/09 vs year ago)        -4.2 pct
Year-over-year:Month (June 2009 vs June 2008) -4.4 pct
Month-over-month: (June 2009 vs May 2009) -4.3 pct
Source: Reuters

Monday, July 6, 2009

Non-Manufacturing ISM 47.0 vs Consensus Forecast of 46.7

The Non-Manufacturing ISM came in at 47 compared to the consensus forecast of 46.7. This signifies the sector is still contracting, but at a slower pace than in May, which had a reading of 44.0. This was the index's best showing in 9 months. The new orders index, which tends to be forward looking rose by 4.2 percentage points to 48.6. The prices index showed the sharpest increase of 6.8 percentage points to 53.7 percent in June. This is the prices index first positive reading since October 2008. This should help to quell any ongoing fears of deflation, but could help to put concerns over inflation back on the table.

The following six industries reported growth in the survey (in order of magnitude): Real Estate, Rental & Leasing; Arts, Entertainment & Recreation; Accommodation & Food Services; Finance & Insurance; Construction; and Information.

The following 11 industries reported contractions in the survey (in order of magnitude): Mining; Agriculture, Forestry, Fishing & Hunting; Wholesale Trade; Transportation & Warehousing; Retail Trade; Management of Companies & Support Services; Public Administration; Health Care & Social Assistance; Professional, Scientific & Technical Services; Educational Services; and Other Services.

Friday, July 3, 2009

US Economic Week Ahead: The Calm after the Storm

This week’s economic calendar is relatively quiet, especially compared to the hustle and bustle of last week. Monday’s non-manufacturing ISM report starts the week off, followed by Wednesday’s consumer credit report, Thursday’s jobless claims data, and Friday’s US trade statistics and consumer sentiment. The impact of this week’s non-manufacturing ISM report could be somewhat subdued since its release comes after June’s employment report; negating the importance the report’s employment index. But, significant declines or advances in the report’s business activity index could help shift market sentiment. This week’s big headlines, however, will likely be driven by the start of the 2Q09 earnings seasons, with Alcoa set to announce earnings on Wednesday. There is also a G8 summit taking place this week in Italy, which could produce some headlines. Here is this week’s US economic calendar:

Monday July 6th:

10:00AM: ISM non-manufacturing Index (Risk: Neutral, Market Reaction: Moderate/Marginal): The non-manufacturing ISM index will likely experience its third consecutive monthly rise. The current Bloomberg consensus for the index is 46.7 compared to last month’s reading of 44.0. The market would take any positive surprises to this index as good news echoing better than anticipated data in the manufacturing sector pointing towards a less severe recession. It will also be important to pay attention to non-manuf. ISM’s new order index, which tends to be a forward looking indicator for the primary business activity index. Since June’s employment report has already been released the employment index is essentially a non-factor.

Tuesday July 7th:

7:45AM: ICSC-Goldman Store Sales (Risk: Downside, Market Reaction: Marginal): This weekly index tracks same store sales at major US retailers, account for roughly 10% of total sales. Given recent data supporting an increasing US saving rates and a worsening employment situation, this index could face some downward pressure. Last week’s number indicated a 1.6% increment in store sales over the previous week.

Wednesday July 8th:

7:00AM: MBA Purchase Applications (Risk: Neutral, Market Reaction: Marginal): This index, which tracks new mortgage applications tends to be a reasonable forward looking indicator for home sales, but issues including customers filling out numerous applications could skew the index. A recent drop in refinancing activity caused this index to drop 18.9% on a weekly basis last week, while the level of mortgages to purchase new homes dropped by 4.5%.

3:00PM: Consumer Credit (Risk: Downside, Market Reaction: Marginal): Consumer credit has contracted quite severely over the past several months as saving rates rise and banks tighten consumer credit. The current Bloomberg consensus indicates a month over month change of –US$7.5bn compared to –US$15.7bn a month prior—the second biggest drop on record. Given recent deterioration in the employment situation and a drop in consumer confidence we could see this indicator disappoint.

Thursday July 9th:

Same Store Sales: (Risk: Downside, Market Reaction: Moderate): This monthly release breaks out same store sales data for individual retail chains. Like weekly the ICSC-Goldman Store Sales index, recent data supporting an increasing US savings rate and a worsening employment situation coupled with deep discounts at some stores, will likely place some downward pressure on same store sales.

8:00AM: Federal Reserve Governor Elizabeth Duke: Is speaking at the FDIC's Interagency Minority Depository Institutions National Conference in Chicago. This could create some headlines.

8:30AM: Initial Claims (Risk: Neutral, Market Reaction: Significant): The current Bloomberg consensus forecast for initial claims is 610K versus last week’s number of 614K. It is likely that after Thursday’s disappointing employment data the market will become more sensitive to changes in claims, as it is an excellent forward looking indicator toward payroll data. I anticipate both initial and continuing claims data will improve as the month progresses.

Friday July 10th:

8:30AM: International Trade (Risk: Neutral, Market Reaction: Marginal/Moderate): The current Bloomberg consensus for the US trade balance is –US$28.8bn versus last month’s reading of –US$29.2bn. Recent increments in oil prices could add to the current deficit, while placing upward pressure on the import price index.

9:55AM: Consumer Sentiment (Risk: Neutral, Market Reaction: Marginal/Moderate): The current consensus on Bloomberg for the Reuters/University of Michigan Consumer Sentiment Index stands at 71.5 versus last month’s result of 70.8. The sentiment index is broken up into two parts, current conditions and future expectations. Investors are likely to focus more on this report after last week’s disappointing consumer confidence number. A positive or negative surprise in this index could impact the day’s trading.

10:00AM: Treasury Secretary Tim Geithner: Is set to testify before the House Financial Services and Agriculture Committees on derivatives regulation. This could create some headlines.

Have a good weekend!

Wednesday, July 1, 2009

June ADP, Comes in Below Expectations

June's ADP release came in at -473,000, implying there could be some downward pressure placed on forecasts for tomorrow's payroll data. Currently, the market is forecasting a -350,000 change in payrolls; I believe we could see this number actually come in around -440,000, which is still much better than the six month average, but below current estimates.

Chinese Manufacturing Shows Marginal Gains

In some upbeat news from China, the Chinese Federation of Logistics and Purchasing (CFLP) index and the CLSA manufacturing index both demonstrated marginal gains in June. The CFLP increased to 53.2 from 53.1 the previous month, while the CLSA index edged up to 51.8 from 51.2. This performance has been driven by China’s extensive stimulus package leading to higher lending and government spending. Possibly more interesting than the headline number was the CLSA index’s export order sub-component, which indicated a marginal expansion with a reading of 50.9 compared to 49.2 the previous month. But, it is important to keep in mind that this number was calculated from a very small base given recent historical declines. Overall, these numbers alone are unlikely to have much of an impact on the dry bulk sector. But, will reinforce the view of a gradual Chinese recovery. It is important to keep in mind that these gains are not yet sustainable without China’s massive fiscal stimulus package. Additionally, extensive loan growth could cause problems in the future for China as the level of non-performing loans is generally expected to rise.

Tuesday, June 30, 2009

Consumer Confidence Disappoints, Shipping Stocks Suffer

As I highlighted in my column on TheStreet.com on Monday shipping stocks will be highly susceptible to any major economic news impacting market's views on the long-term outlook. This mornings consumer confidence number was proof of that, tumbling to 49.3 compared to 54.8 last month. Both the present situation index and the future situation index declined. Most of the recent gains stemmed from increases in the future situation component, which fell this month to 65.5 from 71.5. The present situation index slid to 24.8 from 29.7. The drop was likely fostered by concerns over business conditions and the employment situation.

The recently high betas in the shipping sector over macro data are rooted in the hope that once Chinese demand begins to diminish for dry bulk goods, increases in ex-China demand will offset, or even more than offset, the decline in Chinese imports. But, in order for this to occur it needs to be clear that global economies, especially the US, are on the road to recovery. Any data supporting or opposing this view will significantly impact trading in the shipping sector Nevertheless, today's data may give Thursday's crucial payroll number even more ammunition in the event of an upward or downward surprise.

In other news the Case Schiller Home Price Index came in slightly above analyst's expectations showing a decline of only 18.1%.

Shipping and Mining Stocks

Source: Google (12:42PM)

Saturday, June 27, 2009

US Week Ahead: It's all about the jobs!

Despite the shortened work week, we have a rather busy schedule of US economic data releases, climaxing with Thursday's US employment data. Last month's payroll data caught the market by surprise coming in well above expectations, demonstrating the lowest level of job losses since September 2008. But, the big question remains, was this start of a trend or a one-off anomaly. Other economic news in May sent mixed signals, fueling growing uncertainties, which led to a US treasury rally. What this means is that in many investors' minds this month's payroll data may hold the answer to that important question. Therefore we should expect a signifcant jump in trading volumes on the back of any surprises to that report, with an almost certain equity rally and US rates sell-off on better-than-expected data. However, the opposite is also true. Here is the rest of this week's economic calendar:


Monday June 29th:

8:30AM: Chicago Fed National Activity Index (Risk: Neutral, Market Reaction: Marginal): The CFNAI is an index of 85 separate data sets designed to represent national economic activity and inflationary pressure. A reading of 0 indicates the economy is growing at the historical trend while a negative or positive result indicates the economy is growing below or above its historical average, respectively. Given the volatile nature of this index the three month moving average is typically quoted. This index remains somewhat obscure in the mainstream media and is likely to have a minimal impact on trading.


Tuesday June 30th:

7:45AM: ICSC-Goldman Store Sales (Risk: Downside, Market Reaction: Moderate): This weekly index tracks same store sales at major US retailers, and accounts for roughly 10% of national retail sales. Given recent data supporting an increase to the US saving rates, this index could face some downward pressure as people save more and spend less.

9:00AM: S&P Case-Shiller HPI (Risk: Neutral, Market Reaction: Marginal/Moderate): Despite, the significance of US home price data, this index holds a two month lag, meaning this June's data would actually be from April. This lag marginally reduces the index's importance compared to some of the other more timely housing market indicators. Nevertheless, large movements in this index could imply further deterioration or recovery of the US housing market, which could impact trading.

9:45AM: Chicago PMI-
Business Barometer Index (Risk: Downside, Market Reaction: Marginal/Moderate): The Chicago PMI measures business conditions in the Chicago area; anything below 50 indicates a contraction while a reading above that level implies an expansion. According to Bloomberg, the market is currently forecasting a reading of 44.5. However, given recent weakness in the auto and manufacturing sectors I expect this number could disappoint. It will be important to pay close attention to the new order and prices paid sub-components. The new oders component tends to be forward looking, while the prices paid component experienced a 60 year low of 28.4 in April.

10:00AM: Consumer Confidence (Risk: Upside, Market Reaction: Moderate):
The confidence index, which measures consumers' attitudes towards present and future economic expectations can be a good barometer for consumer spending. This index has recently experienced significant gains as consumers' seem to be focusing on positive economic releases. The current conditions index has remained somewhat stagnant, while the future expectations index experienced an increase of over 20 points last month. However, some deterioration in recent employment data could put some downward pressure on this month's release, but I still believe this index is more likely to surprise to the upside.


Wednesday July 1st:

7:00AM: MBA Purchase Applications (Risk: Neutral, Market Reaction: Marginal): This index, which tracks new mortgage applications tends to be a reasonable forward looking indicator for home sales, but issues including customers filling out numerous applications could skew the index.

8:15AM: ADP Employment Report (Risk: Neutral, Market Reaction: Moderate): The ADP employment report is typically considered a good indicator of the payroll data released later in the week, so a big swing in this data could shift expectations for the employment data released on Thursday and thus significantly impact trading.

10:00AM: ISM Manufacturing Index (Risk: Neutral, Market Reaction: Significant): The ISM measures national manufacturing conditions, a reading of over 50 signifies expansion while under a retraction. The current consensus on Bloomberg is 45. It will be very important to look at the new orders component of the ISM, which tends to be a forward looking indicator for the overall index. New orders finished over 50 last month, for the first time in 17 months, but will likely move back below 50 this month.

10:00AM: Construction Spending
(Risk: Upside, Market Reaction: Marginal): This index tracks the value of new construction activity on residential, non-residential, and public projects. Recent stimulus spending should help drive up the public projects component of the index, and we will likely see a marginal increase in residential spending.

10:00AM: Pending Home Sales
(Risk: Neutral, Market Reaction: Moderate): A strong number in this index would help support the case of a recovery in the US housing market, which could have a moderate impact on trading. However, it is important to note that not all pending home sales turn into actual sales, but it is a good indicator of sentiment.

June Motor Vehicle Sales (Risk: Downside, Market Reaction: Moderate): Increasing savings rate, tight credit conditions, and a weak job market will likely cause car owners to extend the life of their current vehicles, despite incentive offers, reducing total car sales. This will also be exacerbated by what has recently been increasing gas prices. 7.4mn cars and light trucks were sold in May.


Thursday July 2nd:

8:30AM: Employment Situation Report (Risk: Neutral, Market Reaction: VERY Significant): According to Bloomberg, the current market consensus for the change in payrolls stands at -350,000 with an unemployment rate of 9.6%. The average decline in payrolls for the six months preceding April was 643,000 versus 345,000 in May. The market will likely interpret another positive surprise as the beginning of a recovery in the US employment situation, which would lead to a strong rally in equities and selloff for US treasuries; a negative surprise would have the opposite effect. Nevertheless, the unemployment rate will likely drift above 10% in the comings months.

8:30AM: Initial Claims (Risk: Downside, Market Reaction: Significant): This report will be overshadowed by the payroll data, released simultaneously, but is an excellent forward looking indicator for the employment sector. We could see an unexpected jump in claims as the school year ends and teachers who have lost their jobs due to budget cuts begin filing for claims.

10:00AM: Factory Orders (Risk: Upside, Market Reaction: Moderate): Given the recent increment in durable goods orders we could see factory orders surprise to the upside. According to Bloomberg the current consensus forecast for May is a month over month increase of 1.4%.


Friday July 3rd:

Enjoy the long weekend!


Friday, June 26, 2009

FFA Market Rises

Forward Freight Agreements (FFAs), especially for capesize contracts, appreciated significantly today leading to strong trading in the dry bulk sector.

BDI FFA Curve
Source: Imarex

BCI FFA Curve

Source: Imarex

Market and Sector Performance:
Source: Bloomberg, my calculations, Capital Link Shipping

Friday, June 5, 2009

Brazilian Iron Ore Exports Drop in May

A recent release by Brazilian officials showed that iron ore exports fell to 15.3mn tones in May, a drop of 35% from last month and a 2009 low. This is likely due to diminishing demand by the country's largest custom, China. A note released by Goldman Sachs confirms this theory stating, "Heavy rains in the north of Brazil and port congestion in China could have had a negative impact on Brazilian iron ore exports, but the main reason ... is likely lower iron ore demand from China due to high steel and iron ore inventories."

Over the past several weeks, the shipping industry has been experiencing a strong resurgence in activity primarily due to Chinese iron ore imports. However by the end of this week those gains began to reverse, as indicated by a drop in the Baltic Dry Index (BDI). I anticipate the BDI will continue to moderate as Chinese demand continues to diminish, and an over supply of new capacity hits the shipping sector. This will likely add risk not currently priced into equities trading within the space. Companies that have high leverage ratios due to over expansion will be most suscetpible to any downward pressure to shipping prices, while companies with limited expansion plans and low leverage will be better position to weather the coming storm.


For a more detailed analysis please see my column on international trade at TheStreet.com:
http://www.thestreet.com/author/1145075/michael-mcdonough/all.html

Wednesday, June 3, 2009

Swine Flu

If anyone is interested here is a piece I recently published on H1N1 for a patient advocacy group:

http://patientsandpatents.wordpress.com/2009/06/02/a-historical-view-of-flu-pandemics-a-reason-to-remain-vigilant/

Additionally, if you find that interesting you may also enjoy this supplemental piece, which highlights companies that could benefit in the unfortunate event of a H1N1 resurgence.

http://news.newamericamedia.org/news/view_article.html?article_id=38fadb7a58ef4addc245a451e474b8a1

Friday, May 29, 2009

BDI to face downward pressure

As I have discussed in great detail in my TheStreet.com articles; I believe the recent rally in the Baltic Dry Index (BDI) cannot be sustained, and we are likely to see a pullback in the index; along with dry bulk shipping and mining sector stocks. The BDI’s rally has been driven almost exclusively through China’s record demand for raw material stemming from the government’s USD586bn stimulus package. Currently, despite record raw material imports China’s industrial production has actually begun to wane and export growth has turned negative. To put it simply, there’s a lot more going in than coming out; this cannot be sustained.

Without a significant, yet unlikely, increase in global demand for Chinese goods, current imports will only add to record breaking inventory levels. China is currently at or near its maximum inventory levels; meaning it is very likely we will soon begin to see a drop in China’s extraordinary import levels. This diminishing demand will translate into a correction for the BDI and those sectors with high correlations to the index (i.e. miners, shippers, etc…)


The retraction in the BDI will be exacerbated by a record increment in fleet expansions scheduled to be completed over the next 1.5 years. In fact according to my calculations and data from Barry Rogliano Salles, a Paris based shipbroker, the size of the global capesize fleet, which is the largest class of bulk carrier, is expected to rise by 50%. Many analysts believed this magnitude of expansion was irrational even at the peak of shipping in 2008.

Currently, 10% of the estimated 855 global capesize fleet is idle off the shores of China waiting to unload at congested ports, with an average 9 day wait. The growing supply of new vessels combined with the freeing of idle ships off the coast of China will create a supply glut in the sector dragging down shipping prices. Hence my bearish short-term view on the mining sector (BHP, RTP, VALE), and my generally bearish view on the shipping industry, especially for highly leveraged shippers such as Eagle Bulk Shipping (EGLE); companies with lower leverage such as Diana Shipping (DSX) should be better positioned to weather the coming storm.

Again for more details please check out my articles on TheStreet.com.

Monday, May 18, 2009

TheStreet.com

I just wanted to let everyone know that I have also started writing for TheStreet.com, and my articles can be found here:
http://www.thestreet.com/author/1145075/michael-mcdonough/all.html

Thursday, January 22, 2009

The Anatomy of a Global Financial Crisis

I apologize for the recent lack of posts as I got rather caught up with travel and other activities during the holiday season. To start off the year I decided we need to look back before we can look forward. Since the onset of the current crisis we have witnessed what seems like a never ending barrage of unprecedented market conditions and government actions from across the globe. This compiled timeline is meant to act as reference for both the readers and myself, helping us fully comprehend the crisis that has been the past 2 years. So let us begin… (I apologize for the length, but I was hoping to make it as comprehensive as possible using multiple sources) This will be a work in progress and I will likely make numerous additions and deletions over the next several days as I gain access to more sources.

1H 2007:

02/08/07: HSBC announces it is setting aside 20% more than analysts estimated for loan losses in 2006 due to the companies deteriorating US mortgage business. The company announced that home loans to riskier borrowers were going bad faster than estimates. Concurrent with the announcement an index tracking swaps on sub-prime dropped sharply, indicating a significant increase in implied risk. (S&P500: -0.1% TED Spread: 0.3)

02/22/07: Two HSBC top mortgage executives announce departure from US business. (S&P500: -0.1% TED Spread: 0.3)

03/04/07: HSBC confirms they will write off USD11bn to cover mounting losses in its US based HSBC Finance Corporation. (S&P500: -1.1% TED Spread: 0.4)

03/05/07: New Century Financial Co. leads massive drop in US subprime lenders. (S&P500: -0.9% TED Spread: 0.4)

03/12/07: DR Horton CEO announces to investors his company’s fortunes are likely to ‘suck’ in 2007. During the same day trading is suspended on New Century Financial shares as fears rise firm is headed toward bankruptcy. (S&P500: 0.3% TED Spread: 0.4)

03/21/07: Mortgage delinquencies and defaults continue to rise and short sellers reap large rewards for their positions in the US subprime lenders. (S&P500: 1.7% TED Spread: 0.4)

04/02/07: New Century Financial officially files for Chapter 11 bankruptcy; immediately cuts 3,200 jobs. (S&P500: 0.3% TED Spread: 0.4)

04/05/07: Subprime mortgage lender Novastar announces they will stop funding independent mortgage bankers. (S&P500: 0.3% TED Spread: 0.4)

05/30/07: UK mortgage lender Kensington agrees to USD561mn takeover by Investec, a South African Bank. The subprime lender also announces revenues for the current year will be significantly below the previous years. (S&P500: 0.8% TED Spread: 0.7)

2H 2007:

06/23/07: Bear Stearns pledges USD3.2bn to rescue one of its internal hedge funds after it placed bad bets on subprime mortgages. (S&P500: -1.3% TED Spread: 0.8)

07/30/07: IKB cuts profit forecast and replaces its CEO after feeling the effects of the US subprime rout. Additionally, according to Bberg more than 40 companies globally have reorganized or abandoned borrowing plans over the past month. (S&P500: 1.0% TED Spread: 0.5)

07/31/07: American Home Mortgage announces it does not have the cash flow to fund new loans, shares plunge 90%. Bberg reported that creditors made ‘very significant margin calls’ against the company over the past 3 weeks and it still has ‘substantial unpaid margin calls pending’. (S&P500: -1.3% TED Spread: 0.5)

08/02/07: Accredited Home Lenders announces merger with Lone Star Funds may be in doubt and bankruptcy is a distinct possibility. (S&P500: 0.4% TED Spread: 0.6)

08/06/07: American Home Mortgage files for bankruptcy after laying off 7,000 employees. One reason cited is repeated interest rate increases pushing up loan repayments and borrower defaults. (S&P500: 2.4% TED Spread: 0.6)

08/08/07: German WestLB Mellon suspended redemptions from its asset-backed security fund amid concerns over the US subprime mortgage market. The company was quoted as saying current market conditions were making it impossible to calculate the fair net asset value of the fund. (S&P500: 1.4% TED Spread: 0.6)

08/09/07: BNP Paribas halts redemptions from three investment funds due to complications over calculating fair net asset value due to the mortgage markets effects on credit markets. (S&P500: -3.0% TED Spread: 0.8)

08/14/07: Goldman Sachs in conjunction with a group of investors announce a USD3bn injection into the bank’s Global Equity Opportunities Fund, after losing 30% of its value in 1 week. (S&P500: -31.8% TED Spread: 1.0)

08/15/07: Countrywide falls 13% on fears of bankruptcy if conditions continue to deteriorate. (S&P500: -1.4% TED Spread: 1.4)

08/17/07: FOMC approved changes to the primary credit discount window facility reducing the spread between the fed funds target to 50bps. The Fed also announced it would allow term financing for up to 30 days. Finally, in the statement the Fed recognized that ‘downside risks to growth have increased appreciably’, and that they were prepared to take action. Nevertheless, there was no change in the target rate. (S&P500: 2.5% TED Spread: 1.9)

08/21/07: It is reported that German SachsenLB holds USD4bn in US subprime assets. (S&P500: 0.1% TED Spread: 2.0)

08/22/07: H&R Block unable to tap US commercial paper markets due to market turmoil is forced to borrow USD200mn from its credit line. Also, Lehman Brothers becomes the first Wall Street firm to shut down its subprime lending unit, laying off 1,200 employees. Other mortgagee companies announced layoffs totaling 3,700. (S&P500: 1.2% TED Spread: 1.9)

08/23/07: BoA, Citi, & DB borrow USD2bn from the Fed via the discount window to help reduce the ‘last resort’ stigma associated with this lending facility. (S&P500: -0.1% TED Spread: 1.7)

08/29/07: Australian firm Basis Yield files for bankruptcy over subprime defaults. (S&P500: 2.2% TED Spread:1.7)

09/06/07: Inter-bank lending rates continues to soar; the ECB lends USD57bn to banks in a move to help counter the ongoing global credit squeeze. (S&P500: 0.4% TED Spread: 1.5)

09/14/07: Northern Rock receives emergency funding from the Bank of England after rising borrowing costs left the company unable to make new loans. (S&P500: 0.0% TED Spread: 1.7)

09/17/07: Fears of a Northern Rock and/or other financial institution failures cause the government to guarantee Northern Rock deposits to avoid a potential bank run. The same day Novastar, US subprime home lender, forfeits its REIT status as it decides not to pay a dividend on 2006 profit in an effort to conserve cash. (S&P500: -0.5% TED Spread: 1.5)

09/18/07: Stocks rally as Fed announces 50bp rate cut moving the target rate to 4.75%. (S&P500: 2.9% TED Spread: 1.7)

10/05/07: Merrill Lynch announces it will be forced to write down a USD5.5bn loss associated with defaulted US sub-prime mortgages. Analysts are concerned ML’s losses may continue to mount. (S&P500: 1.0% TED Spread: 1.4)

10/24/07: Merrill Lynch announces largest loss quarterly loss in its 93 year history after taking USD8.4bn in write downs. Rating agencies reduce ML’s rating and described the quarterly loss as ‘startling’. (S&P500: -0.2% TED Spread: 1.3)

10/31/07: FOMC decreases fed funds target by 25bps to 4.25%. (S&P500: 1.2% TED Spread: 1.1)

11/08/07: Morgan Stanley reveals a USD3.7bn loss from its US sub-prime mortgage exposure. The bank attributes the loss to the record level of defaults by subprime borrowers. (S&P500: -0.1% TED Spread: 1.6)

11/27/07: Citigroup announces it is selling a USD7.5bn stake to Abu Dhabi to bolster its depleted capital base due to recent acquisitions and credit market turmoil. (S&P500: 1.5% TED Spread: 2.0)

12/10/07: UBS writes off USD10bn in debt linked to subprime mortgage market. The company also reported that losses would total more than the previous year’s profits. Additionally, UBS announced it received USD9.7bn in funds from the Singapore Government Investment Corporation. MBIA, the world’s largest bond insurer announces it will raise as much as USD1bn by selling a stake to a private equity to avoid losing its AAA credit rating. Finally, Bank of America announced it will liquidate a USD12bn cash fund due to turmoil in credit markets. These type of funds attempt to return a higher yield vs. traditional money market funds via positions in riskier assets. (S&P500: 0.8% TED Spread: 2.2)

12/11/07: The Fed reduces target rate 25bps to 4.25%. However, markets reacted adversely interpreting the action and the statement as too weak considering current market conditions. (S&P500: -2.5% TED Spread:2.2)

12/13/07: Due to fears of what effects a elevated inter-bank lending rates could have on the global economy the Fed in conjunction with the central banks of Canada, England, Switzerland, and the EU announced’ measures designed to address elevated pressures in short-term funding markets.’ This announcement setup the temporary Term Auction Facility (TAF) designed to ‘auction term funds to depository institutions against the wide variety of collateral that can be used to secure loans at the discount window’. (S&P500: 0.1% TED Spread: 2.2)

12/14/07: Citi announces it will take over seven troubled Special Investment Vehicles (SIVs) and assume USD58bn in debt to avoid forced assets sales. On the news Moody’s lowered Citi’s credit rating to Aa3 from Aa2, and warned of further potential downgrades. As an interesting aside, Citi invented SIVs in 1988. (S&P500: -1.4% TED Spread: 2.2)

12/17/07: Fed auctions USD20bn to major banks in an attempt to alleviate the global credit crunch as banks remain hesitant to lend based on market uncertainty. (S&P500: -1.5% TED Spread: 1.9)

12/18/07: In response to the Fed the ECB allocates USD500bn to banks at below market rates in a refinancing move to ease tightened credit markets and lower LIBOR. (S&P500: 0.6% TED Spread: 1.9)

12/19/07: As default risks rise, Standard & Poor’s reduces the rating outlooks for many bond insurance companies including MBIA, XL Capital Assurance, and Ambac Financial. According to Bberg industry-wide downgrades would lead to losses of USD200bn on securities as banks would be forced to sell bonds due to investment guidelines. (S&P500: -0.1% TED Spread: 2.1)

12/24/07: Merrill Lynch after experiencing the largest loss in the company’s history receives a USD6.2bn cash injection from Singapore’s Temasek Holdings. At this point in the crisis sovereign wealth funds have already invested over USD25bn in Wall Street banks. (S&P500: -0.8% TED Spread: 1.6)

1H 2008

01/11/08: Bank of America purchases faltering US home lender Countrywide Financial for USD4bn in an all stock deal. (S&P500: -1.4% TED Spread: 1.2)

01/15/08: Citi announces USD18.1bn in write-downs related to its subprime mortgage exposure. Concurrently, in a move to shore up its capital base Citi announces it will cut its dividend. The same day, Merrill Lynch reported it sold a USD6.6bn stake to foreign investors including the Korean and Kuwaiti governments. (S&P500: -2.5% TED Spread: 0.9)

01/22/08: As global financial conditions continue to deteriorate the Fed announces a rare inter-meeting rate cut of 75bps to 3.50%, this was the largest cut in 25 years. (S&P500: -1.1% TED Spread: 1.4)

01/30/08: The Fed cuts rates by an additional 50bps to 3.00% in an attempt to help avoid a US recession. Statement reads; "Financial markets remain under considerable stress, and credit has tightened further for some businesses and households." (S&P500: -0.5% TED Spread: 1.1)

02/14/08: UBS confirms loss for 2007 as exposure to US housing market hits earnings. The firm warned of poor performance and USD18.4bn in write downs weeks earlier. The firm also revealed an additional USD26.6bn in exposure to risky mortgages. UBS’s losses were far worse than analysts’ estimates. (S&P500: -1.3% TED Spread: 0.8)

03/03/08: HSBC announces a USD17.2bn loss derived from the effect of the decline in the US housing market on its loan values. However, annual profits still rose 10%. (S&P500: 0.1% TED Spread: 1.3)

03/06/08: A large hedge fund run by Peloton Partners collapses as it can no longer make interest payments on loans made to the company to buy assets, forcing the fund to sell assets at substantial losses. (S&P500: -2.2% TED Spread: 1.6)

03/07/08: Ambac raises roughly USD1.5bn in a sale of convertible stock to maintain AAA credit rating. Some analysts report this will only work as a short-term fix. (S&P500: -0.8% TED Spread: 1.5)

03/08/08: The Fed announces two new initiatives to address growing liquidity pressures in the term funding markets. These include increases in the amounts outstanding to the TAF to USD100bn, and a series of term repurchase transactions totaling an additional USD100bn. (S&P500: -0.8% TED Spread: 1.5)

03/11/08: The Fed issues a statement that G10 central banks continue to work closely together on liquidity issues, but pressures have continued to rise. Further coordinated actions between the Fed, Bank of Canada, Bank of England, ECB, and Swiss National Bank were also announced, which included expansion of its securities lending program and the introduction of a Term Securities Lending Facility (TSLF). Also, Carlyle Fund, a mortgage-debt investment fund, asked lenders to halt further liquidation of collateral worth roughly USD16bn. (S&P500:3.7% TED Spread: 1.4)

03/14/08: JPMorgan and the Fed bailout Bear Stearns ending the banks 85 year run; the Fed released a statement declaring, ‘The Board voted unanimously to approve the arrangement announced by JPMorgan Chase and Bear Stearns this morning.’ (S&P500: -2.1% TED Spread: 1.6)

03/16/08: The Fed announces two new initiatives intended to bolster market liquidity and stabilize volatile market conditions. The first created a lending facility to assist primary dealers to provide financing to the securitization markets. The second was to reduce the primary credit rate to 3.25% from 3.50%. Finally, they approved increasing the maximum maturity of primary credit loans to 90 days from 30, and approved the financing agreement for JP Morgan to purchase Bear Stearns. (S&P500: -2.1% TED Spread: 1.6)

03/18/08: The Fed announces an additional 75bp cut in the fed funds target moving the rate to 2.25% as the market continue to deteriorate and the probability of a US recession rises. (S&P500: 4.2% TED Spread: 1.6)

03/25/08: JPMorgan increases original USD2/share Bear Stearns offer to guarantee quick deal after pressure from shareholders. (S&P500: -0.2% TED Spread: 1.4)

03/31/08: Treasury Secretary Henry Paulson proposes the largest overhaul of US financial regulations since the Great Depression, saying the system for overseeing American capitalism needs to be better prepared for ‘inevitable market disruptions.’ (S&P500: 0.6% TED Spread: 1.3)

04/01/08: UBS announces additional write downs of USD19bn related to the US housing market. At the same time Deutsche Bank discloses write downs totaling USD4bn on US real estate loans and assets. Total write downs by banks at this point now equal roughly USD200bn. (S&P500: 3.6% TED Spread: 1.3)

04/04/08: Fitch downgrades MBIA to AA from AAA stating the bond insurer no longer has enough capital to warrant the top ranking. Fitch reported MBIA would have needed as much as USD3.8bn more in capital to deserve an AAA. (S&P500: 0.1% TED Spread: 1.4)

04/08/08: Washington Mutual raises USD7bn from an investment group led by private equity group TPG after failing to shore up finances. The nation’s largest savings and loans bank had been adversely affected by rising delinquencies and mortgage defaults. The company’s efforts to shore up financing via cutting dividends and a USD3bn stock sale fell short forcing WAMU to seek external financing. (S&P500: -0.5% TED Spread: 1.3)

04/14/08: Wachovia, considered to be a relatively conservative player in the banking world, announces a USD393mn quarterly loss and a 41% dividend cut. (S&P500: -0.3% TED Spread: 1.6)

04/18/08: Citigroup reports a better than estimated loss of USD5.11bn for Q1, rallying 4.5% for the day. At this point Citi’s write-downs and credit losses total almost USD40bn. (S&P500: 1.8% TED Spread: 1.6)

04/21/08: A group of mutual and hedge funds led by Corsair Capital invest USD7bn to recapitalize National City Bank, 10th largest in the US, after losing USD333mn in 4Q07. (S&P500: -0.2% TED Spread: 1.6)

04/22/08: As banks continue trying to raise capital, Merrill Lynch receives USD9.6bn via bond and preferred share sales after writing down USD6.5bn in assets. Concurrently, RBS announces additional losses of USD11.7bn related to the US subprime market and will attempt to raise USD24bn in new capital to shore up reserves. (S&P500: -0.9% TED Spread: 1.7)

04/29/08: Citi announces it will sell USD3bn of stock to improve capital reserves. Analysts were upset with this move as they were hoping Citi could avoid an equity sale as it will dilute shareholder equity. Also on this day HBOS, the UK’s largest mortgage lender, announced it will sell USD8bn in shares to bolster capital depleted by asset write downs and a deteriorating housing market. (S&P500: -0.4% TED Spread: 1.4)

04/30/08: The Fed again reduces the fed funds target this time by 25bps to 2.00%. Concurrently, Citi sells USD4.5bn worth of stock vs. the USD3bn originally planned. The company is raising capital to avoid further credit-rating downgrades, maintain client relationships, and preserve access to financing. Analysts estimate Citi would need to raise USD 10-15bn to truly sure up its capital reserves. (S&P500: -0.4% TED Spread: 1.4)

05/02/08: The Fed, ECB and Swiss National Bank announce expansions to the ongoing liquidity measures, including increases to the TAF, and expansion of accepted collateral for the Term Securities Lending Facility (TSLF). (S&P500: 0.3% TED Spread: 1.3)

05/06/08: Fannie Mae receives permission from regulators to expand activities in light of failing mortgage market, and plans to raise USD6bn in capital and cut its dividend to USD0.25 from USD0.35. Regulators also reduced the company’s surplus capital requirement to 15% from 20% to expand business. (S&P500: 0.8% TED Spread: 1.2)

05/07/08: Vallejo CA plans to file for bankruptcy as the decline in the housing market cuts into the town’s tax revenues. (S&P500: -1.8% TED Spread: 1.1)

05/09/08: Citi CEO Vikram Pandit announces plans to ‘wind down’ roughly USD400bn in assets over the next three years to help return the bank to profitability. According to Robert Olstein, CIO of Olstein Capital, ‘He's carting off the non-significant operations and raising money so that he can reinvest it in the business he's in, which is loaning money.’ (S&P500: -0.7% TED Spread: 1.0)

05/13/08: Federal Reserve Chairman Bernanke sends letter to Congress requesting expedited approval to pay interest on reserves deposited by commercial banks to help alleviate tension in the credit market. (S&P500: 0.0% TED Spread: 0.9)

05/19/08: Regulatory filings show that banks and securities firms are keeping USD35bn of markdowns off income statements. At this point total write downs total about USD344bn. (S&P500: 0.1% TED Spread: 0.9)

05/26/08: UBS announces ‘the bank’s losses on non-US residential and commercial real-estate securities could increase in the future’. UK home prices dropped for the eighth straight month with no slowdown in sight. (S&P500: -1.3% TED Spread: 0.8)

2H 2008

06/02/08: S&P cuts credit-ratings for Morgan Stanley, Merrill, & Lehman. These downgrades could potentially have adverse business impact via selling derivative products, increased counter-party risk, etc… S&P said, ‘…actions reflect prospects of continued weakness in the investment banking business and the potential for more write-offs, though not of the magnitude of those of the past few quarters.’ Risks of further equity dilution via equity sales to bolster capital reserves remain high. Additionally, shares of Britain’s largest buy-to-let mortgage lender Bradford & Bingley plunge on profit warnings and sale to TPG. (S&P500: -1.1% TED Spread: 0.9)

06/05/08: Despite efforts to maintain credit ratings MBIA and Ambac Financial, the world’s largest bond insurers, are downgraded from AAA to AA by S&P. These companies together insure roughly USD1trn in debt. Moody’s announced they were placing both companies on review for a possible downgrade the day prior. (S&P500: 1.9% TED Spread: 0.9)

06/09/08: Lehman Brothers reports a Q2 loss of USD3bn and will raise USD6bn in stock sale. This was Lehman’s first loss since going public. "I am very disappointed in this quarter's results. Notwithstanding the solid underlying performance of our client franchise, we had our first-ever quarterly loss as a public company," said Chairman and Chief Executive Richard Fuld Jr. "However, with our strengthened balance sheet and the improvement in the financial markets since March, we are well positioned to serve our clients and execute our strategy." (S&P500: 0.1% TED Spread: 0.8)

06/12/08: KeyCorp plunges in trading on its move to raise USD1.5bn through equity sales and plan to cut dividends by 50%, citing unforeseen charges. "The loss, in our view, seems one-time in nature since it stemmed from an unfavorable court ruling. Also, KeyCorp reaffirmed its guidance for charge-offs in 2008 at 100-130 basis points and said that the new capital was only done due to the quarterly loss," DB’s financial analyst Mike Mayo wrote. "Yet, KeyCorp is raising $300-$400 million more than the loss given the environment." (S&P500: 0.3% TED Spread: 0.8)

06/18/08: Fifth Third Bancorp falls in trading after announcing it will cut dividends and raise USD2bn in capital to shore up capital reserves. (S&P500: -1.0% TED Spread: 0.9)

06/25/08: The Fed votes to keep rates unchanged at 2.00%. Also, California sues Countrywide Financial which lost USD2.5bn amid rising defaults and foreclosures over lending practices. (S&P500: 0.6% TED Spread: 1.0)

07/07/08: Freddie Mac & Fannie Mae drop sharply to 13 year lows on concerns over capital. A credit strategist at DB said, ‘There's a lot of apprehension about write downs… If they have write downs, they have to raise capital. How much do they raise and how easily can they do that? Those are the questions that everybody is asking’. Mortgage delinquencies continue growing at a record pace while home prices continue to plummet. (S&P500: -0.8% TED Spread: 1.0)

07/11/08: IndyMac is seized by US regulators after a run by depositors left the mortgage lender short on cash. IndyMac specialized in Alt-A mortgages (no documentation mortgages), which undoubtedly was one of the primary catalysts for its downfall. (S&P500: -1.1% TED Spread: 1.2)

07/13/08: Treasury Secretary Paulson announces a plan to temporarily increase the line of credit available to the GSEs to ensure they have sufficient capital to conduct business and protect the financial system from systemic risk moving forward. The Fed also approved a measure to lend to Fannie and Freddie if necessary. (S&P500: -1.1% TED Spread: 1.2)

07/18/08: A rights offering to shareholders of Barlcays and HBOS receive lukewarm response achieving minimal participation. (S&P500: 0.0% TED Spread: 1.3)

07/25/08: National Australia Bank makes additional provisions of USD830mn for credit crisis exposure. “Although current losses on the assets underlying the CDOs in our portfolio relating to the provision average approximately 2 per cent of the total portfolio, out detailed analysis and recent default activity indicates the portfolio will continue to deteriorate.” (S&P500: 0.4% TED Spread: 1.1)

07/28/08: Merrill writes down an additional USD5.7bn and is forced to sell more equity. Merrill’s CEO John Thain is pushing to rid the firm of its collateralized debt obligations (CDOs), the primary driver behind the firms USD18.7bn loss to date; many of these instruments are linked to subprime mortgages. (S&P500: -1.9% TED Spread: 1.1)

07/30/08: Fed announces additional measures to enhance the effectiveness of its existing liquidity facilities. These measures include longer maturities to the Fed’s Term Auction Facility (TAF) and increases in the level of swaps with the ECB and Swiss National Bank. (S&P500: 1.7% TED Spread: 1.1)

08/05/08: Fed leaves target rate unchanged at 2.00% and indicates a tightening bias in minutes. (S&P500: 2.9% TED Spread: 1.1)

08/20/08: Analysts announce Fannie and Freddie may need to raise as much as USD100bn to cover potential losses from declining mortgage market. Shares drop sharply in trading on the news. Higher implied credit risk and tight credit markets make it increasingly difficult for either organization to raise funds. It has also been revealed secret talks by Lehman Brothers to sell a 50% stake to South Korean or Chinese investors have failed. The reason for the failure is said to be Lehman was asking for too high of a price. (S&P500: 0.6% TED Spread: 1.1)

09/07/08: Government seizes control of Fannie and Freddie by placing both companies into a special conservatorship by the Federal Housing Finance Agency & US Treasury. The Treasury will be able to purchase USD100bn of a special class of stock in each company to maintain a positive net worth, and also be able to provide short-term funding. (S&P500: 0.4% TED Spread: 1.2)

09/15/08: The effects of US housing crisis force Lehman Brothers to file for nation’s largest bankruptcy after being unable to find a suitor. Almost simultaneously, Bank of America announced they would acquire Merrill Lynch. Additionally, fears of an AIG failure continue to mount. Despite the Fed announcing several measures to enhance existing liquidity measures, due immeasurable uncertainties testing the market in face of the this news the market experienced a significant decline for the day. (S&P500: -4.7% TED Spread: 1.8)

09/16/08: The market still reeling from yesterday’s news learns that in order to prevent the imminent failure of AIG the Fed will lend the company USD85bn and receive a 79.9% equity stake. In an attempt to calm the market Treasury Secretary Paulson is quoted saying, ‘We are working closely with the Federal Reserve, the SEC and other regulators to enhance the stability and orderliness of our financial markets and minimize the disruption to our economy,’ At the same time, despite expectations the Fed keeps rates unchanged at 2.00%. (S&P500: 1.8% TED Spread: 2.0)

09/17/08: The US Treasury at the request of the Fed introduces a supplementary financing program to provide cash for use by the Federal Reserve. (S&P500: -4.7% TED Spread: 3.0)

09/18/08: At 3:00pm EST the Fed in conjunction with the ECB, Bank of Canada, Bank of England, and Swiss National Bank announce an unprecedented coordinated action to improve liquidity conditions in global financial markets. The Fed authorized an additional USD180bn expansion of current swap lines to provide USD funding. At this point it seems clear the Fed preferred to manage credit vs. conducting monetary policy to deal with the current crisis. Markets reverse declines over the course of the day. (S&P500: 4.3% TED Spread: 3.0)

09/19/08: Congress and Treasury officials reveal negotiations are underway to establish a rescue akin to the Resolution Trust Corporation (RTC) setup to liquidate the assets of failed savings and loan associations (S&Ls) in the early 90s. The idea would be for the government to relieve financial markets of toxic debt adversely impacting market conditions. The fed also announces two further enhancements to its liquidity program 1) extending non-recourse loans at primary credit rate to US depository institutions and bank holding companies in order to purchase high-quality asset backed commercial paper from money market funds, & 2) to purchase agency discount notes from primary dealers. (S&P500: 4.0% TED Spread: 2.2)

09/21/08: Goldman Sachs and Morgan Stanley place requests and are reclassified as bank holding companies from investment banks. The Fed provides both banks with liquidity to smooth the transition against any collateral ‘that may be pledged at the Federal Reserve's primary credit facility for depository institutions or at the existing Primary Dealer Credit Facility (PDCF).’ The G7 finance ministers via a statement to reaffirm their strong and shared commitment to international financial stability. (S&P500: x% TED Spread: x)

09/24/08: Additional swap lines are setup between the Fed, the Reserve Bank of Australia, Denmark’s National Bank, Norges Bank, and Sverriges Riksbank to alleviate pressure in the USD short term funding market. (S&P500: -0.2% TED Spread: 3.0)

09/25/08: Washington Mutual fails after concerns cause customers to withdraw USD16.7bn of deposits since September; this is the largest bank failure in US history. Remaining assets were sold to JP Morgan Chase. (S&P500: 2.0% TED Spread: 3.0)

09/26/08: The Fed along with the Bank of England, ECB, and Swiss National Bank again agree to increase swap lines to further alleviate funding pressure. (S&P500: 0.3% TED Spread: 2.9)

09/29/08: UK mortgage lender Bradford & Bingley and Iceland’s Glitnir bank are nationalized, Fortis NV is bailed out by the Belgium, Netherlands, and Luxembourg governments, and finally the Fed, ECB, Bank of England, and Bank of Japan inject more liquidity into the system via special term financing and TAF increases. The FDIC also announces that Citi will acquire the banking operations of Wachovia, ‘in a transaction facilitated by the Federal Deposit Insurance Corporation and concurred with by the Board of Governors of the Federal Reserve and the Secretary of the Treasury in consultation with the President.’ Finally, the Bush administrations financial rescue plan was rejected by Congress leading to a 777 point drop in the Down Jones Average. (S&P500: --8.8% TED Spread: 2.9)

09/30/08: In order to prevent further bank failures the Irish, Belgium, Luxembourg, and French monetary authorities move to action. The Irish authorities guarantee deposits at major banks, while the remainder injects money into Dexia SA to prevent its failure. (S&P500: 5.3% TED Spread: 3.2)

10/01/08: The US Senate approves financial rescue plan, which had been rejected by the House earlier in the week. The House will re-vote on a modified version of the bill October 3rd. (S&P500: -0.3% TED Spread: 3.3)

10/03/08: US House approves modified Emergency Economic Stabilization Act of 2008. Furthermore, in a change of plans Wachovia agrees to a merger with Wells Fargo, walking away from FDIC assisted deal with Citi. It is also announced portions of Fortis bank are being nationalized by Dutch government. (S&P500: -1.4% TED Spread: 3.8)

10/06/08: With new authority granted by the rescue act the Fed announces plans to begin paying interest on depository institutions’ required excess reserve balances, and approve substantial increases in the size of the TAF. Germany’s second largest property lender Hypo Real Estate receives USD68bn rescue package. (S&P500: -3.9% TED Spread: 3.7)

10/07/08: Central banks across the world move to counter the growing financial crisis ranging from additional nationalizations in Iceland to rate cuts in Australia. The Fed unveils its Commercial Paper Funding Facility (CPFF), ‘a tool that will complement the Federal Reserve's existing credit facilities to help provide liquidity to term funding markets’. (S&P500: -5.7% TED Spread: 3.5)

10/08/08: To prevent a collapse in the banking sector the UK Treasury announces the availability of at least USD350bn under a special liquidity scheme to recapitalize the system. Additionally, the US, UK, Canada, Sweden, Switzerland, and the EU conduct a coordinated rate cut of 50bps. Hong Kong and China also cut rates, but by 100bps and 27bps, respectively. Finally, the ongoing short-selling ban expires at midnight and the Fed reduces the minimum fee of the System Market Account securities lending program to 0.10% from 0.50% while also increasing the aggregate limit to USD5bn from USD4bn. (S&P500: -1.1% TED Spread: 3.9)

10/09/08: Fed authorizes NY Federal Reserve Bank to borrow securities from AIG for up to USD37.8bn. (S&P500: -7.6% TED Spread: 4.2)

10/12/08: G7 central bankers and finance ministers release a plan of action which includes injecting capital into banks and guaranteeing interbank loans. Further measures were announced by the Fed, ECB, Bank of England, Bank of Japan, and Swiss National Bank to improve liquidity in the short-term USD funding market. Australia also announces to will guarantee bank deposits for three years to combat global financial crisis. (S&P500: -1.2% TED Spread: 4.6)

10/13/08: RBS, HBOS, and Llyods will receive USD64bn from the British government to improve tier one capital ratios. Germany pledges USD681bn to recapitalize banking sector. (S&P500: 11.6% TED Spread: 4.5)

10/14/08: US Treasury, Fed, and FDIC announce measures to implement the newly approved USD750bn rescue package (TARP), which will guarantee loans, extend insurance to non-interest bearing account, and inject capital into banks. The Fed also increases the magnitude of its swap lines with Japan. (S&P500: -0.5% TED Spread: 4.3)

10/15/08: ECB injects a further USD250bn of liquidity into the market in a continued attempt to reignite credit markets; it also announces they will accept lower rated securities and a wider range of currencies as collateral from banks. Finally, the ECB approved a USD6.7bn loan to the fledgling economy in Hungary. (S&P500: -9.0% TED Spread: 4.3)

10/16/08: The Fed makes two announcements, the more significant of the two now permits bank holding companies to account for its senior perpetual preferred stock issue to the Treasury as Tier 1 capital. The Swiss National Bank injects USD5.3bn into UBS, taking a 9.3% stake in the company, while Credit Suisse is able to raise capital from private investors and the Qatar Monetary Authority. (S&P500: 4.3% TED Spread: 4.1)

10/21/08: The Fed introduces the Money Market Investor Funding Facility (MMIFF). The facility is designed to provide liquidity to US money market investors through providing, ‘senior secured funding to a series of special purpose vehicles to facilitate an industry-supported private-sector initiative to finance the purchase of eligible assets from eligible investors.’ In other news, Bank of Canada reduces its overnight rate by 25bps to 2.25%, and cash injections by European banks continue to be well received by market participants. (S&P500: -3.1% TED Spread: 2.7)

10/22/08: Wachovia reports a 3Q08 loss of USD23.9bn on write-offs and mortgage losses. The Fed alters its formula to calculate interest rate paid to depository institutions on excess balances reducing the spread between the target funds rate and rate paid on excess balances to help propagate trading in the funds market at levels closer to the target. (S&P500: -6.1% TED Spread:2.5)

10/23/08: Reserve Bank of New Zealand and Sveriges Riksbank both cut reference rates 100bps and 50bps, respectively. (S&P500: 1.3% TED Spread: 2.6)

10/27/08: Japanese authorities indicate they would be willing to intervene to bring down the price of the yen after it experience sharp appreciation as investors continued to unwind the carry trade. (S&P500: -3.2% TED Spread: 2.7)

10/28/08: In a response to the decline in the AUD Australian government officials intervene in the market for the third consecutive day to prop up the currency. Declining commodity prices and a weaker economic outlook are the primary drives behind the currency’s recent weakness. The Fed also announces a new swap line with the Reserve Bank of New Zealand for US15bn. Finally, the IMF, World Bank, and ECB agree to lend a combined USD25.1bn to the Hungary in a bid to restore confidence. (S&P500: 10.8% TED Spread: 2.7)

10/29/08: The Fed once again cuts the target rate by 50bps to 1.00%; statement highlighted moderation in inflation and risks to growth. The Fed also announced new swap lines for up to USD30bn with Banco Central do Brasil, Banco de Mexico, Bank of Korea, and the Monetary Authority of Singapore. (S&P500: -1.1% TED Spread: 2.8)

10/31/08: The Bank of Japan cuts its reference rate by 20bps to 0.30%. (S&P500: 1.5% TED Spread: 2.6)

11/03/08: Recent data releases point to continue tightening in US loans market for both commercial and residential uses. US auto sales reach lows not experienced since the early 80s. (S&P500: -0.3% TED Spread: 2.4)

11/04/08: The Reserve Bank of Australia cuts rates by 75bps to 5.25%. (S&P500: 4.1% TED Spread: 2.2)

11/05/08: The Fed again changes formula use dot determine the interest rate on required and excess reserve balances. Rate will now equal the lowest FOMC target rate in effect during the reserve maintenance period. (S&P500: -5.3% TED Spread: 2.1)

11/06/08: Both the Bank of England an ECB cut reference rates by 150bps to 3.00% and 50bps to 3.25%, respectively. Wells Fargo sells USD11bn in stock to help fund purchase of Wachovia, and states it may sell an additional 61mn shares. (S&P500: -5.0% TED Spread: 2.1)

11/10/08: Fed approves application of American Express to become a bank holding company; at which point Amex requests funds via the emergency rescue package. (S&P500: -1.3% TED Spread: 1.9)

11/12/08: Secretary Paulson announces the TARP will be used primarily to inject capital into banks and extend loan guarantees to credit cards, auto loans, and student loans. (S&P500: -5.2% TED Spread: 2.0)

11/19/08: Citi announces it will purchase the remaining USD17.4bn in assets held by its structured investment vehicles (SIVs), market responds adversely shares plunge 23% in trading. (S&P500: -6.1% TED Spread: 2.1)

11/20/08: Swiss National Bank cuts its target range for 3-month LIBOR by 100bps to 0.5%-1.5%. Ailing auto lender GMAC submits application to become bank holding company in order to gain access to TARP funds. ‘As a bank holding company, GMAC would obtain increased flexibility and stability to fulfill its core mission of providing automotive and mortgage financing to consumers and businesses,” the company said in a statement. “GMAC also expects to have expanded opportunities for funding and for access to capital as a bank holding company.’ (S&P500: -6.7% TED Spread: 2.1)

11/23/08: Citigroup receives a bailout from the US government which includes guarantees, liquidity access and injection of USD20bn in capital. The government receives USD27bn in preferred shares, or roughly a 4.5% stake in the company. (S&P500: 6.3% TED Spread: 2.1)

11/25/08: The Fed introduces the Term Asset-Backed Securities Loan Facility (TALF) designed to assist the credit needs of households and small businesses via issuing asset-backed securities collateralized by student loans, auto loans, credit card loans, and loans guaranteed by the SBA. Another program was initiated to purchase obligations of the housing-related GSEs and MBS back by Fannie, Freddie, and Ginnie. Additionally, US mortgage lender Downey Financial files for Chapter 7 bankruptcy. (S&P500: 0.7% TED Spread: 2.1)

11/26/08: People’s Bank of China lowers one-year lending and deposit rate by 108bps, and reduces reserve requirements by 200bps. Meanwhile, Iceland’s Glitnir Bank files for Chapter 15 bankruptcy in the US. (S&P500: 3.5% TED Spread: 2.1)

11/28/08: A failed stock offering by RBS forces the UK government to become a majority stakeholder with a 58% stake in the company. (S&P500: 1.0% TED Spread: 2.2)

12/01/08: NBER officially recognize US recession, place start date as December 2007. (S&P500: -8.9% TED Spread: 2.2)

12/02/08: Fed announces that the PDCF, AMLF and TSLF will be extended through April 2009. US auto sales continue to plummet. The Reserve Bank of Australia cuts rates by a further 100bps to 4.25%. (S&P500: 4.0% TED Spread: 2.2)

12/03/08: The Reserve Bank of New Zealand follows suit and cuts rates by 150bps to 5.00% as economic conditions deteriorate. (S&P500: 2.6% TED Spread: 2.2)

12/04/08: ECB cuts rates by 75bps to 3.25%. Bank of England cuts rate 100bps to 2.00%. Sweden’s Riksbank cuts rates 100bps to 2.00%. (S&P500: -2.9% TED Spread: 2.2)

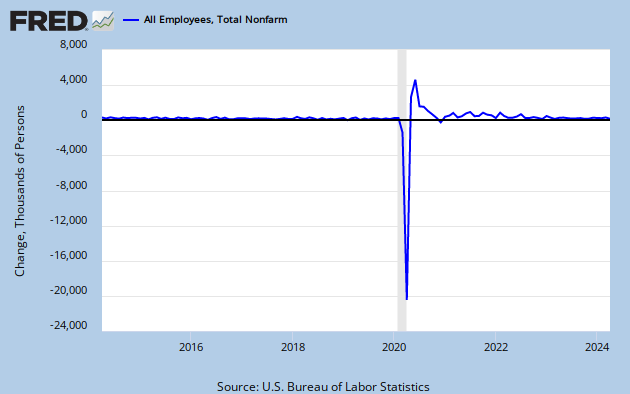
12/05/08: US non-farm payrolls see biggest decline (-533k) since 1974. (S&P500: 3.6% TED Spread: 2.2)

12/08/08: US government irons out deal with US automakers to provide bridge financing through 1Q09. Deal entails some government oversight and requirement to construct a plan of action for the reorganization of the industry. Deal still requires Congressional approval. (S&P500: 3.8% TED Spread: 2.2)

12/09/08: Bank of Canada reduces rates by 75bps to 1.50%. Yield on 4-wk US T-Bill reaches 0%. (S&P500: -2.3% TED Spread: 2.1)

12/11/08: US Senate fails to approve bridge loan to automakers which was previously approved by House to guarantee funding for the remainder of the year. (S&P500: -2.9% TED Spread: 2.0)

12/15/08: AIG sells USD39.3bn in assets to NY Fed. The move was designed to help rid AIG of its obligations on mortgage debt. (S&P500: -1.3% TED Spread: 1.8)

12/16/08: The Fed once again takes an unprecedented action moving the fed funds target rate to a range of 0%-0.25% from 1.00%. The statement said, "The Federal Reserve will employ all available tools to promote the resumption of sustainable economic growth and to preserve price stability," and "The focus of the Committee's policy going forward will be to support the functioning of financial markets and stimulate the economy through open market operations and other measures that sustain the size of the Federal Reserve's balance sheet at a high level." This action represents a shift from traditional monetary policy to quantitative easing. (S&P500: 5.1% TED Spread: 1.8)

12/18/08: Citi’s credit rating is lowered by Moodys to A2 from Aa3 reflecting, ‘weakened earnings prospects, in combination with an average quarterly preferred dividend of approximately $1.4 billion’ according to Moodys. (S&P500: -2.1% TED Spread: 1.5)

12/19/08: The Fed modifies the TALF program extending the term of loans from 1 year to 3 years and adds additional specifications of eligible ABS collateral. Loans will also now be available to all eligible investors rather than being distributed through an auction. The bank of Japan also reduced its uncollateralized overnight target by 20bps to 0.10%. Bush administration and US Treasury officials work out a deal with US automakers to use TARP funds to keep companies afloat through March 2009. (S&P500: 0.3% TED Spread: 1.5)

12/20/08: Latvia receives USD10.4bn loan from the IMF and EU to strengthen the country’s economy and banking system. (S&P500: x% TED Spread: x)

12/22/08: People’s Bank of China cuts rate for the 5th time. (S&P500: -1.8% TED Spread: 1.5)

12/23/08: AMEX, now a bank holding company, receives USD3.39bn from TARP to ensure the company’s survival. (S&P500: -1.0% TED Spread: 1.4)

12/24/08: The Fed approves GMAC’s request to become a bank holding company permitting it to access TARP funds. (S&P500: 0.6% TED Spread: 1.5)

12/29/08: GMAC receives USD5bn equity investment through TARP funds, while GM obtains USD1bn in assistance to purchase equity in GMAC. (S&P500: -0.4% TED Spread: 1.4)

12/30/08: The Fed announces it will start TALF operations in January to purchase mortgage-backed securities backed by Fannie, Freddie, and Ginnie. In addition, now government controlled Indymac Bancorp is set to be sold to a group of private investors. (S&P500: 2.4% TED Spread: 1.4)

1H 2009

01/05/09: Fed begins purchasing fixed rate MBS backed by Fannie, Freddie, and Ginnie via TALF. (S&P500: -0.5% TED Spread: 1.3)

01/07/09: The Fed adopts two changes to the MMIFF 1) expansion of the institutions eligible to participate & 2) adjustments to several parameters including minimum yield on assets, "to enable the program to remain a viable source of backup liquidity for money market investors even at very low levels of money market interest rates." (S&P500: -3.0% TED Spread: 1.3)

01/08/09: The Bank of England cuts rates by 50bps to 1.50% citing declines in confidence and tight credit markets. (S&P500: 0.3% TED Spread: 1.3)

01/13/09: Citi sells Smith Barney to Morgan Stanley in a bid to raise cash, in turn ending its ‘financial supermarket’ legacy. (S&P500: 0.2% TED Spread: 1.0)

01/15/09: Citi announces it will be split into two units to separate its core business from its troubled assets. It is also announced BoA will receive an additional USD20bn to guarantee against loan losses. Ireland is forced nationalize third largest bank, Anglo Irish, as funding position receded. JPMorgan announces profits fell 76% due to rising defaults and the ongoing US recession. (S&P500: 0.1% TED Spread: 1.0)

01/19/09: UK introduces further bailouts for the financial sector including increasing stake in RBS in return for an increment in lending. (S&P500: 0.8% TED Spread: x)

01/20/2009: The Bank of Canada cuts rates by 50bps to 1.00% citing a deteriorating outlook for the global economy. S&P downgrades Spain from AAA quoting structural weakness in the Spanish economy. (S&P500: -5.3% TED Spread: x)