Due to Popular Demand Fiat Economics is Expanding and has moved to its own Domain:

Showing posts with label Home Sales. Show all posts

Saturday, June 27, 2009

US Week Ahead: It's all about the jobs!

Despite the shortened work week, we have a rather busy schedule of US economic data releases, climaxing with Thursday's US employment data. Last month's payroll data caught the market by surprise coming in well above expectations, demonstrating the lowest level of job losses since September 2008. But, the big question remains, was this start of a trend or a one-off anomaly. Other economic news in May sent mixed signals, fueling growing uncertainties, which led to a US treasury rally. What this means is that in many investors' minds this month's payroll data may hold the answer to that important question. Therefore we should expect a signifcant jump in trading volumes on the back of any surprises to that report, with an almost certain equity rally and US rates sell-off on better-than-expected data. However, the opposite is also true. Here is the rest of this week's economic calendar:


Monday June 29th:

8:30AM: Chicago Fed National Activity Index (Risk: Neutral, Market Reaction: Marginal): The CFNAI is an index of 85 separate data sets designed to represent national economic activity and inflationary pressure. A reading of 0 indicates the economy is growing at the historical trend while a negative or positive result indicates the economy is growing below or above its historical average, respectively. Given the volatile nature of this index the three month moving average is typically quoted. This index remains somewhat obscure in the mainstream media and is likely to have a minimal impact on trading.


Tuesday June 30th:

7:45AM: ICSC-Goldman Store Sales (Risk: Downside, Market Reaction: Moderate): This weekly index tracks same store sales at major US retailers, and accounts for roughly 10% of national retail sales. Given recent data supporting an increase to the US saving rates, this index could face some downward pressure as people save more and spend less.

9:00AM: S&P Case-Shiller HPI (Risk: Neutral, Market Reaction: Marginal/Moderate): Despite, the significance of US home price data, this index holds a two month lag, meaning this June's data would actually be from April. This lag marginally reduces the index's importance compared to some of the other more timely housing market indicators. Nevertheless, large movements in this index could imply further deterioration or recovery of the US housing market, which could impact trading.

9:45AM: Chicago PMI-
Business Barometer Index (Risk: Downside, Market Reaction: Marginal/Moderate): The Chicago PMI measures business conditions in the Chicago area; anything below 50 indicates a contraction while a reading above that level implies an expansion. According to Bloomberg, the market is currently forecasting a reading of 44.5. However, given recent weakness in the auto and manufacturing sectors I expect this number could disappoint. It will be important to pay close attention to the new order and prices paid sub-components. The new oders component tends to be forward looking, while the prices paid component experienced a 60 year low of 28.4 in April.

10:00AM: Consumer Confidence (Risk: Upside, Market Reaction: Moderate):
The confidence index, which measures consumers' attitudes towards present and future economic expectations can be a good barometer for consumer spending. This index has recently experienced significant gains as consumers' seem to be focusing on positive economic releases. The current conditions index has remained somewhat stagnant, while the future expectations index experienced an increase of over 20 points last month. However, some deterioration in recent employment data could put some downward pressure on this month's release, but I still believe this index is more likely to surprise to the upside.


Wednesday July 1st:

7:00AM: MBA Purchase Applications (Risk: Neutral, Market Reaction: Marginal): This index, which tracks new mortgage applications tends to be a reasonable forward looking indicator for home sales, but issues including customers filling out numerous applications could skew the index.

8:15AM: ADP Employment Report (Risk: Neutral, Market Reaction: Moderate): The ADP employment report is typically considered a good indicator of the payroll data released later in the week, so a big swing in this data could shift expectations for the employment data released on Thursday and thus significantly impact trading.

10:00AM: ISM Manufacturing Index (Risk: Neutral, Market Reaction: Significant): The ISM measures national manufacturing conditions, a reading of over 50 signifies expansion while under a retraction. The current consensus on Bloomberg is 45. It will be very important to look at the new orders component of the ISM, which tends to be a forward looking indicator for the overall index. New orders finished over 50 last month, for the first time in 17 months, but will likely move back below 50 this month.

10:00AM: Construction Spending
(Risk: Upside, Market Reaction: Marginal): This index tracks the value of new construction activity on residential, non-residential, and public projects. Recent stimulus spending should help drive up the public projects component of the index, and we will likely see a marginal increase in residential spending.

10:00AM: Pending Home Sales
(Risk: Neutral, Market Reaction: Moderate): A strong number in this index would help support the case of a recovery in the US housing market, which could have a moderate impact on trading. However, it is important to note that not all pending home sales turn into actual sales, but it is a good indicator of sentiment.

June Motor Vehicle Sales (Risk: Downside, Market Reaction: Moderate): Increasing savings rate, tight credit conditions, and a weak job market will likely cause car owners to extend the life of their current vehicles, despite incentive offers, reducing total car sales. This will also be exacerbated by what has recently been increasing gas prices. 7.4mn cars and light trucks were sold in May.


Thursday July 2nd:

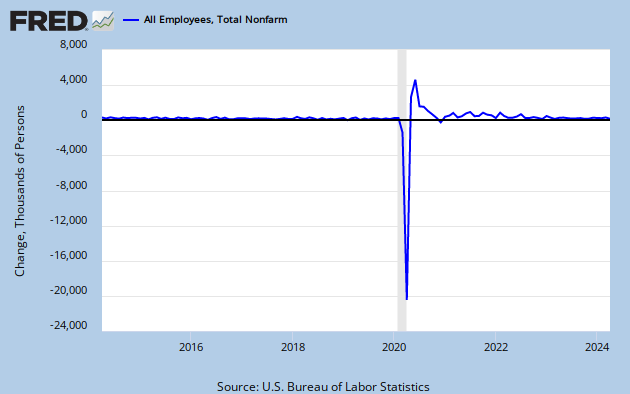
8:30AM: Employment Situation Report (Risk: Neutral, Market Reaction: VERY Significant): According to Bloomberg, the current market consensus for the change in payrolls stands at -350,000 with an unemployment rate of 9.6%. The average decline in payrolls for the six months preceding April was 643,000 versus 345,000 in May. The market will likely interpret another positive surprise as the beginning of a recovery in the US employment situation, which would lead to a strong rally in equities and selloff for US treasuries; a negative surprise would have the opposite effect. Nevertheless, the unemployment rate will likely drift above 10% in the comings months.

8:30AM: Initial Claims (Risk: Downside, Market Reaction: Significant): This report will be overshadowed by the payroll data, released simultaneously, but is an excellent forward looking indicator for the employment sector. We could see an unexpected jump in claims as the school year ends and teachers who have lost their jobs due to budget cuts begin filing for claims.

10:00AM: Factory Orders (Risk: Upside, Market Reaction: Moderate): Given the recent increment in durable goods orders we could see factory orders surprise to the upside. According to Bloomberg the current consensus forecast for May is a month over month increase of 1.4%.


Friday July 3rd:

Enjoy the long weekend!


Wednesday, March 5, 2008

How will it end?

We are continuously being barraged with mixed news concerning the housing crisis. One day we hear signs are pointing towards a bottom; the next housing numbers came in much lower than expectations. So we raise this question: What indicators should we be looking at to truly signal a recovery in housing?

With this question in mind our analysis focused on creating the stages we believe would be necessary to facilitate a recovery. We were able to define 7 chronological stages which need to occur in order for the crisis to end. Additionally, the progress for each of the stages can be measured by several key indicators. The stages we outline below are meant to help to average investor better understand how a recovery will most likely unfold, and includes indicator that anyone with a basic internet connection will be able to easily access.

Our stages and key indicators to watch:

1. The number of defaults from subprime borrowers needs to drop substantially. This will help to stabilize growing inventory levels. Key Indicator(s): RealtyTrac foreclosure data (monthly) & MBA foreclosure data (quarterly)

Subprime ARM mortgage resets continue to be the primary driver behind subprime foreclosures (July 2007-November 2009)

2. Banks need to lower lending standards for home mortgages. This will allow existing and new home sales to increase and prices to stabilize. Key Indicator(s): Fed Senior Loan Officer Survey, mortgage rates (quarterly), Case Shiller Home price index (monthly), & New and Existing home sale prices

However, lending standards have tightened across all mortgage types according to the Senior Loan Officer Survey
Source: FRB

3. Once people are again able to buy homes we will see a reduction in inventory levels. When this occurs demand will rise for new constructions. Key Indicator(s): New home sales data (monthly) & Existing home sales data (monthly)

But for now increased Foreclosures and tighter Lending Standards have caused New Home Sales to drop
Source: Census

4. The rise in demand for new construction will first show up in building permits. The rise in building permits will lead to our next step... Key Indicator(s): Building permits data (monthly)

But, building permits have shown no signs of relief
Source: Census

5. Very soon after the rise in building permits we will see an increase in housing starts. Key Indicator(s): Housing starts data (monthly)

Currently, with Permits being repressed, Building Starts are acting accordingly
Source: Census

6. The increase in starts will lead to an increase in construction spending. Key Indicator(s): Construction Spending (monthly)

As you can see from this chart, this is not yet the case
Source: Census

7. Finally, residential investment begins to rise and the housing crisis is over. Key Indicator(s): Residential Investment via GDP release (quarterly)


Conclusion:

Essentially, this crisis is occurring due to a substantial increase in the supply of houses through subprime foreclosures, and a decrease in demand to buy houses through harder to get mortgages. As more homes enter the market and less people are able to acquire mortgages to by them the price drops. Hence, the first major step in a recovery for the sector will be a slow-down in the number of foreclosures, which likely will not occur into the early parts of the second half of this year. Secondly, and equally important banks need to reduce lending standards to allow qualified buyers to purchase new homes. These two actions combined will begin to reduce the inventory of homes on the market and stabilize price. Once the amount of inventory of homes for sale begins to drop, we will see demand for new constructions begin to rise. This will first show up in the building permits index, followed by housing starts, and finally private construction spending. All in all, this will not be a fast process, with the reduction in foreclosures and lowering of lending standards being the hardest hurdle to overcome.

Currently, the primary driver for subprime foreclosures are interest rate resets. When these borrowers we first given their mortgages they were given low teaser rates which would eventually reset into higher adjustable rates. Meaning some mortgage holders who were paying USD1,200 a month for their mortgage in November could be paying USD3,200 a month in December. For a lot of these borrowers it has been nearly impossible to pay the new amount and they have been forced to default. On a positive note, based on available market information we should see the number of resets for adjustable rate subprime mortgages peak sometime in late spring/early summer. However, this means there are still a lot of resets in front of us which will prevent a sustainable recovery over the next few months. Are best estimates are indicating we should start to see the early signs of a recovery in 3Q08.

Investment Idea:
Once a the market starts showing signs of a sustained recovery we feel that US home builders could significantly benefit. US homebuilder stocks have been pounded since the housing crisis first began, and will be poised to make a recovery as demand for new homes eventually rises. However, as we said this could take some time, but it will happen. In fact, we recently witnessed a rally in the sector when the market misinterpreted last month's housing data to imply we had reached a bottom. To us this means we aren't the only people looking at this trade. We had actually picked up a long position of ITB at around 18 with the intent of holding for the long term. However, when the market rallied on what we felt wasn't substantial evidence for a recovery we sold the position at around 21. The ETF has since returned to trading at around 16, and we are considering re-purchasing for the long-term.

Performance of Home Builder ETFs
Source: Bloomberg