Due to Popular Demand Fiat Economics is Expanding and has moved to its own Domain:

Tuesday, July 8, 2008

A Quick Look at the Asian CDS Market

Recently, I have been attempting to locate data on the Asian credit default swap (CDS) market, specifically on sovereign protection; I couldn’t find much. In response I decided to put together this posting, which tracks performance and allows for some basic relative value and correlation analysis verse equity markets. All CDS prices quoted in this entry are 5yr protection on each governments’ international bonds.

A credit default swap is an agreement between two parties, in which one party pays a premium to the other party, who in return provides protection against the default of an underlying bond. A CDS can be written or bought by anyone, even if they do not own the underlying bond. Since the price of the CDS is the amount a buyer is willing to pay for protection against a potential default it goes without saying that the price is a good measurement of market implied risk. This also means there should be some correlation between sovereign ratings and the sovereign CDS prices.

To start, let’s take a look at the three major rating agencies rating systems. The chart below breaks out each of the major rating companies systems, with the green area representing investment grade ratings and the red area representing non-investment grade ratings. I have also included the credit ratings of the Asian countries for each of the 3 agencies (see below).

Moodys, S&P, & Fitch Credit Ratings

Asian Countries Credit Rating

Next, I created a composite rating system for the countries being analyzed. To do this I assigned number values to the above rating system with the highest rating for each agency equaling 1, and the lowest rating equaling 21. In the case an agency had a positive outlook for any given country I subtracted 0.5 from their score (i.e. a S&P rating of AA would equal 3, but an AA rating with a positive outlook would equal 2.5). I then averaged these results together for each country and created the consolidated rating (see chart below).

Composite Asian Credit Ratings

You can see from the chart above that for each country, except Vietnam, current CDS prices correspond well to each countries composite credit rating. The next step is to look at each countries CDS performance to determine shifts in implied market risk, especially given the current credit crisis and large equity sell-offs.

Historical 5yr CDS Japan, Hong Kong, & China

Hong Kong - China 5yr CDS Spread

Source: Bberg

Over the past couple of months CDS prices in Hong Kong and China have seen a significant rise, this corresponds to the recent equity sell-off in both countries. Japanese CDS prices also rose, but remained somewhat contained compared to Hong Kong and China. It is important to highlight that year to date the Nikkei 225 is down 14.86% verse 23.70% & 46.5% for the Hang Seng and Shanghai indices, respectively. Recently, we have witnessed significant volatility between the Hong Kong and Chinese 5yr CDS spread; nevertheless the spread has begun to revert back to its historical average of around 12bps.

Historical 5yr CDS Korea, Malaysia, & Thailand

Source: Bberg

Similar performance can be seen for 5yr CDS in the Korean, Malaysian, and Thai markets. Generally speaking we have seen the spreads between Thailand, Malaysia and Korea moving tighter during the recent volatility.

Historical 5yr CDS Philippines, Indonesia, & Vietnam

Source: Bberg

Finally, and possibly most interesting we have seen 5y CDS move significantly higher in Vietnam. This comes despite the fact that over the past several years the spread between 5yr Vietnamese CDS and that of Indonesia and the Philippines has remained relatively constant. I believe the reason for this is due to growing concern over Vietnam’s economy and a growing conflict between the government plan to maintain economic growth and the central bank’s goal of controlling growing pricing pressures.

Finally, the following charts show each countries’ CDS movements verse the main domestic equity Index; CDS could be used as a hedge against regional equities. CDS prices tend to have a negative correlation with a country’s underlying equity index. This notwithstanding, hedging an individual equity via sovereign CDS will likely not hedge against intra-day or company specific price movements but will hedge against fundamental economic changes within the country. It is important to keep in mind that companies with traded debt may have its on CDS. However, at this point within Asia this market does not yet seem to be very robust.

Charts:

Source: Bberg


List of CDS traded in Asia

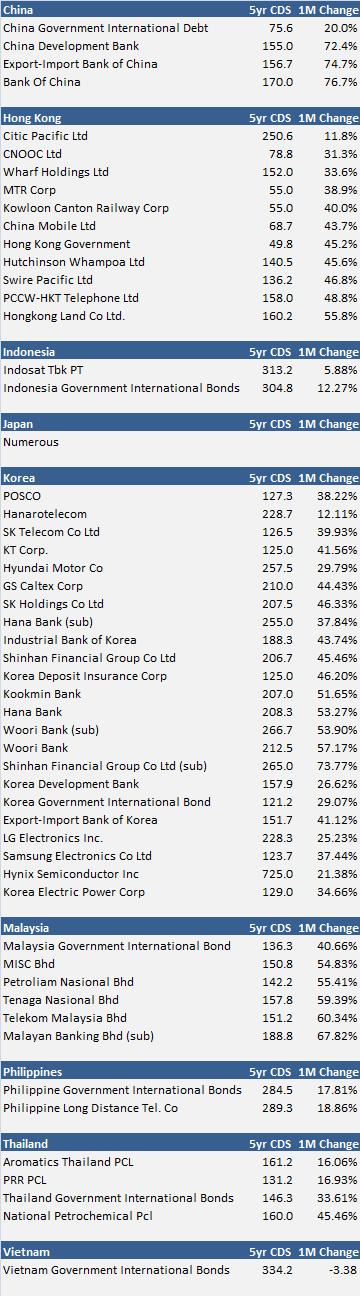
Source: Bberg (pricing from 7/7/08)

Friday, July 4, 2008

S&P500 Short Interest Ratio

Back in March I published some data on the NYSE top 100 short interest ratio (SIR), and a lot of people seemed to enjoy it. I am now following that up with June SIR data for all the S&P500 companies. I broke out the data alphabetically, descending SIR, and by the monthly change of the short interest ratio. Please follow the links below for the tables.

Sorted By:
Company Name
SIR Largest to Smallest
SIR Change (6/30/08-6/15/08)

*Source:Bberg

How might this be helpful? Well besides giving investors an idea of market sentiment on specific securities or sectors; it also creates the opportunity for a potential short squeeze. A short squeeze is when investors cover their short positions in order to stop losses by purchasing the equities on the open market, in theory bringing up the securities price. So, the higher the SIR the higher the potential magnitude of a short squeeze. The Short interest ratio is the amount of days it would take to cover the equities total short interest given its average daily trading volume.

Wednesday, July 2, 2008

Global Battery Index

As oil prices continue soaring and consumers’ preference shifts to smaller and more fuel efficient vehicles, we are likely to see a proliferation of hybrid technology. Looking at the most recent car sales data in the US, Honda and Hyundai out-sold both GM and Ford mostly due to their wide selection of smaller more fuel efficient vehicles. So what does this have to do with batteries? I believe quite a lot... It would appear the next natural progression in the auto industry will be the development and sale of plug-in hybrids (PHEV). Thus far, production of PHEVs has been extremely limited, mostly due to battery related issues. However, given the current record oil prices and recent advancements in battery technology it is likely this market will show significant growth over the next several years.

Currently, both GM and Toyota are hoping to release PHEVs by 2010. While Ford’s current plan is to release PHEVs sometime between 2012 and 2020. However, Ford’s senior energy storage manager was recently quoted saying, ``If there's going to be a true plug-in hybrid market, we're going to be there. It's just that that's a huge commitment to actually go to production.'' Which indicates to me that for the time being Ford will be sitting on the side-line. Coincidentally, Ford’s June sales decreased by 28%, mostly due to their lack of fuel-efficient cars and trucks relative to some of their peers.

The proliferation of hybrids & PHEVs would place large demands on the battery industry, which could provide investors with good investment opportunities within the sector. However, I personally know very little about the players in the global battery industry, so I decided to give myself a quick primer. According to Bberg’s industry classification system, globally the batteries & battery systems sector has 105 members. With this in mind, I decided to create a global market-cap weighted index to track the overall performance of the sector. Out of the 105 companies my index ended up containing 71 members, I factored out companies with bad data and Energizer. I factored out Energizer because of their large market cap, and since as far as I know they are not developing any automotive related battery products. The average market cap of the index totaled USD225.38mn, with BYD co Ltd of China (1211 HK Equity) having the highest market cap of USD2.6bn (16.4% of index). See the chart below for more details.

Index Components with Weighting

Source: Bberg

I now wanted to compare the performance of the index against the S&P500 and WTI prices. To do this I used daily prices and rebased all the prices to 100 on 8/2/2007 (see charts below):

The Global Battery Index has Outperformed the S&P500

Source: Bberg

The Global Battery Index has a Positive Correlation with WTI Prices

Source: Bberg

As you can see from the charts above the global battery index easily out-performed the S&P500 and shows a strong positive correlation to WTI prices. This implies that if energy prices continue to rise or remain elevated we could continue to see the battery outperform the S&P500 as battery related demand increases.

Once this was complete, I geographically broke out the companies. 20 of the 71 companies in the index are located within the US, followed by China with 9, South Korea with 8, and India with 6 (see chart below for more details):

The Top 5 Countries make-up 83% of the Market Cap

Source: Bberg

As you can see from the chart above China, the US, Japan, India, and Taiwan together make-up roughly 83% of the total market cap, while containing 58% of the total companies. To further assist this analysis I created country specific indices to compare against the benchmark; at first I found the results surprising.

Chinese Battery Index

American Battery Index

Japanese Battery Index

Indian Battery Index

Taiwanese Battery Index

*Source: Bberg for all charts

Relative to the overall battery index it is clear that Japan was a significant out-performer. This I believe can partially be explained by the fact that Japan imports nearly 100% of its oil, which among other factors, has led the government to announce oil and gas suppliers will be required to increase the use of renewable energy resources. The government's pro-active approach coupled by the fact that Japanese automakers, such as Honda and Toyota, seem to be on the forefront of hybrid technology should continue to bolster Japanese demand for battery related products. The three Japanese companies included in the index are GS Yuasa Corp, NPC Inc, & Shin-Kobe Electric Machinery Co. Mitsubishi Motors setup a joint venture with GS Yuasa corporation in Dec. 2007 to provide lithium-ion batteries starting in April 2009. According to Bberg, Shin-Kobe was recently rated a buy from Nomura Holdings Inc. who cited an increasing demand for batteries.

Will the other countries within the index follow suit? I beleive so, but further analysis would be needed to isolate specific equities best positioned to take advantage of the potential increase in demand, and I am not in the habit of recommending specific equities on this blog. The bottom line is, as long as oil prices remain elevated we should continue to see increased demand for battery related products as automakers begin moving towards more hybrid and PHEV technology.

Thursday, June 19, 2008

Gold a Bet Against the Fed

Historically, gold has been an asset investors turn to in times of uncertainty, especially in regards to inflation. The same is true today. However, is the level of today’s gold prices justified? I believe the answer to that question depends on your belief in the Fed’s effectiveness and willingness to fight inflation. It is my view that once core CPI begins to approach and exceed the Fed’s comfort zone we will see the beginning of a new tightening cycle, regardless the economic growth outlook. In May core CPI came in at 2.3%, our current estimations point towards the ceiling of the Fed's comfort zone to be around 2.8% to 3.0%. Once this tightening cycle begins to occur or at least look imminent the USD broad index should begin to appreciate.

With this in mind I created a back of the envelope analysis to calculate monthly gold prices from 1974 to today based on CPI, the USD broad index, and effective fed funds rate. The results were surprisingly promising:

Regression Statistics


R^2

0.83


Coefficients

T Score

Intercept


-28.1

-1.8

CPI


7.5

40.2

USD Broad Index


-8.5

-29.0

Fed Funds


1108.8

10.2

This simple model has tracked gold price fairly accurately since 1974

*Source: BBerg

The graph above shows that according to the model current gold prices are somewhat elevated, but this is likely due to increasing inflation expectations and recent uncertainty in the financial markets, which this model does not account for. What this model does imply however is that if you believe the Fed will act to combat inflation and we see an appreciation in the USD due to increased rates we are likely to see a decline in gold prices. For example, leaving CPI constant, according to the model if Fed Funds were to move to 3.0% and we saw a 5% appreciation in the USD broad index we would se a decrease in gold prices to about USD750, with a 10% USD appreciation we would see gold prices around USD700. Further increases in CPI could off-set some of these losses, but our view is that the Fed’s actions will be enough to curtail increasing inflation expectations, and bring core CPI back into the Fed’s comfort zone, thus in the long run bringing gold prices closer to its historical average.

It is important to note the simplistic nature of this model and is only meant to highlight the mechanics behind how CPI, USD, and rates affect gold prices leaving out many other important factors. In what we would consider an unlikely case if the Fed was unable to control inflation then we would likely see a further jump in gold prices coupled with an appreciation of the USD broad index as he Fed increases rates. Again, we do not advise trading on this simple model.

Monday, April 7, 2008

The Week Ahead: Earnings Take Center Stage

Last week’s data was more or less in-line with my expectations; excluding the stronger than anticipated manufacturing numbers. However, for the reasons I outlined in my previous posting, considerable downside risks remain in place for the ISM over the coming months. Friday’s lower than expected payroll data combined with deteriorating jobless claims has likely convinced the vast majority of investors that the US is in the midst of a recession. This is probably good news for equity markets, especially in terms of reducing volatility. The fact that it is widely agreed the US is in a recession should remove a level of uncertainty from the market. Investors will begin analyzing data to determine the length and severity of the recession, and not whether or not a recession will occur. I believe this should help reduce market volatility around data releases which demonstrate slight deviations of actual vs. consensus forecasts. To put it simply, you expect to see negative data during a recession… (Just not too negative)


Additionally, it appears the market has mostly accepted the fact that the Fed is near the end of this rate cut cycle. This means the market should not be as concerned about indicators, such as CPI, effecting potential future rate cuts. However, if Core CPI and/or Core PCE were to rise drastically (+3.0% yoy) a situation could arise where the Fed contemplates increasing rates, but this scenario is unlikely in the short term.

The upcoming week will be relatively quiet in terms of economic data (Consumer Credit on Monday, Claims and Trade Balance on Thursday, and Import Prices and Consumer Sentiment on Friday). However, this week brings the start of earnings season, which has the potential to bring some volatility to the market. Here is this week’s earnings calendar according to Yahoo Financial:

Earnings Calendar from Yahoo Finance


Source: Yahoo Finance